

14 October 2026

Alexander Chieffalo
In this article
This edition of Market Minute examines rising yields, central bank expectations, and energy risks, followed by the weekly calendar and technical analysis of ten markets.
Market overview
The Fed raised rates to 3.75%–4.00% in a hawkish unanimous vote, signalling higher terminal rates through 2027 to combat persistent inflation. With October hike odds crossing 56% and 10-year Treasury yields pushing near 2007 highs, the US dollar hit a seven-week peak, keeping borrowing costs elevated globally.
Central bank shifts extended beyond Washington, creating severe FX volatility. The Bank of Japan raised its target rate to 1.25% its highest since 1995 yet the Yen suffered its worst weekly fall in nearly a year as officials offered no clear path for further tightening, raising the threat of official currency intervention. Meanwhile, the Bank of England held rates at 3.75%.
Energy markets saw modest relief despite persistent geopolitical threats. While shipping flows through the Strait of Hormuz hit a six-month high, Houthi attacks on Saudi Arabia’s East-West pipeline kept supply concerns active, leaving WTI near $100 and Brent at $104. Softer crude gave gold room to rebound off two-month lows.
Attention now shifts to Thursday’s high-stakes Trump-Xi summit in Washington, where trade truce expirations, potential new US tariffs, and AI competition take center stage alongside upcoming flash PMIs and key global central bank decisions.
Key Events This Week
Monday
- Japan market holiday through Wednesday (USD/JPY)
- ECB President Lagarde speech (EUR/USD)
Tuesday
- RBA Governor Bullock speech (AUD/USD)
- ECB President Lagarde speech (EUR/USD)
Wednesday
- German HCOB Manufacturing, Services and Composite PMI, preliminary (EUR/USD)
- Eurozone HCOB Manufacturing, Services and Composite PMI, preliminary (EUR/USD)
- US S&P Global Manufacturing and Services PMI, preliminary (USDX, NDX100, Gold)
Thursday
- Australia Employment Change and Unemployment Rate (AUD/USD)
- SNB Interest Rate Decision, Monetary Policy Assessment and Press Conference (USD/CHF)
- Trump and Xi summit at the White House (HK50, AUD/USD, NDX100)

US Dollar Index (USDX)
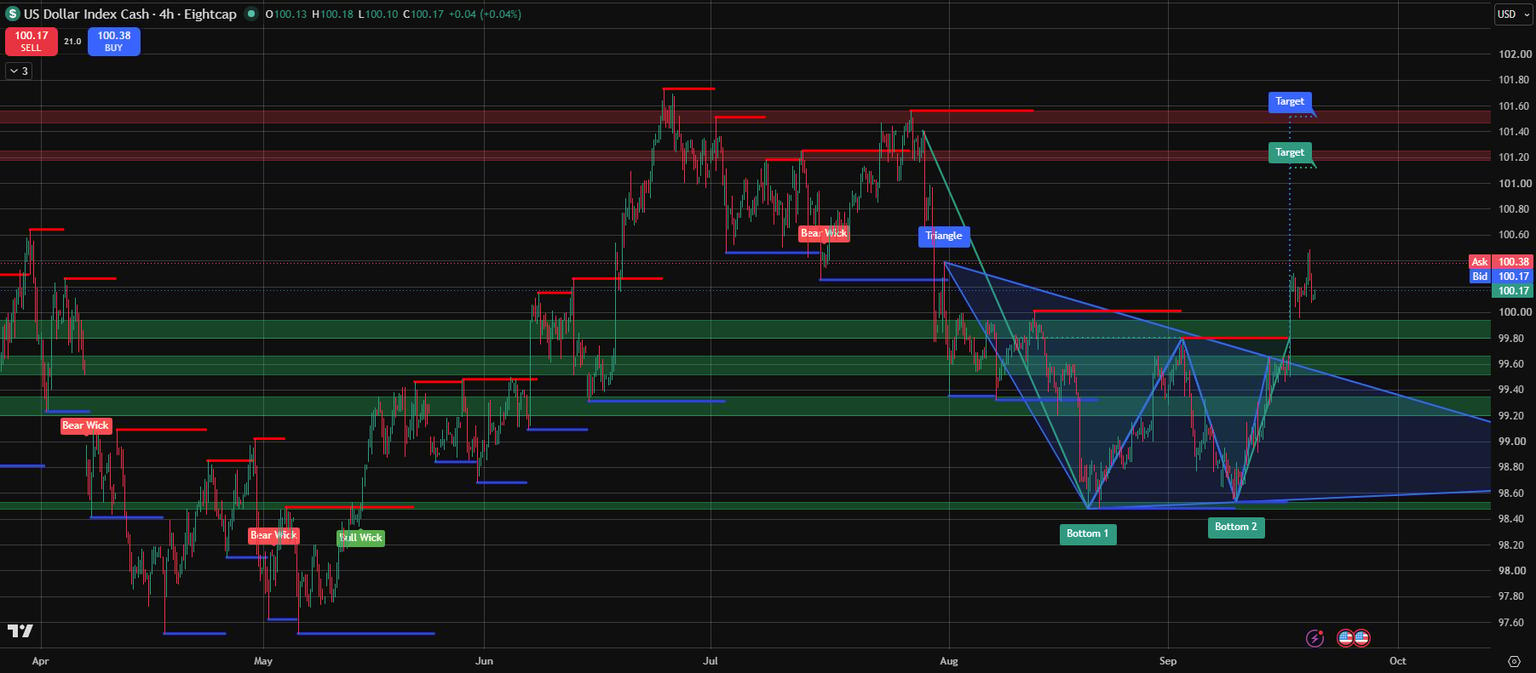
The Dollar Index trades near 100.17, back above the round number after touching 100.56 on Friday. The hike itself was priced; the dots were not. Last week we wrote that consensus expected the projections to show rates drifting toward 3.1% over time, a Fed tightening now and unwinding later. That is not what arrived. The committee now sees another hike this year and rates held at 4.00% to 4.25% through 2027, alongside higher growth, lower unemployment and higher inflation projections.
Warsh was direct about why, saying the plain fact is that inflation is too high and has been for too long. Kansas City Fed President Jeffrey Schmid added on Friday that price pressures are running above 3% and are broad based rather than confined to energy. Warsh attributed the rise in long term yields mainly to a strong economy, competition from debt issued to fund the AI buildout, and geopolitics, which is the more benign reading of the move. With October now more likely than not, Wednesday's flash PMIs are the first test of whether activity supports it.
Price Levels
- Support: 100.00 → 99.80 → 99.50
- Resistance: 100.48 → 101.20 → 101.50
Technical View: The double bottom flagged last week, with lows at 98.45 and 98.50 inside the triangle from late July, has now triggered the break of its 99.80 neckline. Measured targets at 101.20 and 101.50 match second and third resistance, and the old neckline becomes support beneath the round 100.00.
Outlook: Bullish bias. The pattern is active and the rate path has moved in the Dollar's favour, with a move back below 99.80 the signal the breakout has failed.
Gold (XAU/USD)
Gold trades near 4,360 after rebounding from a near two month low of 4,235 set during Fed week. Rising into a central bank that just signalled more hikes is counterintuitive, and the explanation is oil: softer crude capped the Dollar's advance while Middle East risk kept a bid under the metal. Resistance at 4,400 held on Friday, with the session high at 4,399.
The constraint is real yields rather than inflation. WSJ analysis this week noted that the market's best guess at ten year average inflation has barely moved this year, from 2.25% to 2.33%, while most of the rise in Treasury yields has come through the real rate. That is the more difficult backdrop for an asset that pays no coupon, because it reflects confidence the Fed will do its job rather than fear that it won't.
Price Levels
- Support: 4,310 → 4,257 → 4,200
- Resistance: 4,450 → 4,510 → 4,700
Technical View: The July falling wedge broke higher with a measured target at 4,700, which the rally nearly reached in late August before pulling back. Price has since built a base between 4,250 and 4,300, with the 100 day average near 4,320 and the 50 day near 4,288 sitting just beneath.
Outlook: Neutral. The base is holding, but 4,400 caps the recovery while real yields stay near their highs.
.png?format=pjpg&auto=webp&width=1536&quality=75&branch=main)
Japanese Yen (USD/JPY)
USD/JPY trades near 157.03 after the Yen's worst week in almost a year. The BoJ delivered its hike but the market wanted more, and Ueda said the terminal rate for the cycle was difficult to determine while giving little away on pace. Swaps now price less than a 20% chance of another move in October, against almost 90% for December. HSBC's view is that the joint intervention and a second hike in three months can stabilize the pair rather than trigger a downtrend.
Intervention is the variable. The reported rate check on Friday is the step that usually precedes action, and Japan's holiday through Wednesday creates the same kind of thin market the authorities used around Golden Week, when they stepped in beyond 160. Positioning adds to the risk: hedge funds turned long the Yen in the week to 15 September for the first time since July 2025, just before the BoJ disappointed. Morgan Stanley MUFG strategists expect the external backdrop to remain a headwind for the currency.
Price Levels
- Support: 156.66 → 154.68 → 153.26
- Resistance: 158.00 → 158.90 → 160.40
Technical View: A near vertical rebound from the 153 base has retraced most of September's decline in under two weeks, and price is now pushing into the 158 to 159 band that capped the pair through August. The 200 day average near 158.42 and the 50 day near 159.09 both sit inside that band, with 160.40 above it.
Outlook: Bullish bias. Momentum favors higher, but the next leg runs into the moving averages and the zone where Tokyo has acted before, in a week where thin liquidity would amplify any intervention.
_.png?format=pjpg&auto=webp&width=1536&quality=75&branch=main)
Euro (EUR/USD)
EUR/USD trades near 1.1478 after steadying in the days following the FOMC. ECB policymakers remain overwhelmingly hawkish, tying their view to energy driven inflation, and German producer prices surprised higher on Friday. That keeps relative policy expectations roughly balanced even after the Fed's move.
Wednesday's flash PMIs carry the domestic test. German services are forecast at 50 from 49.7, sitting exactly on the line between expansion and contraction, while manufacturing is expected at 54.5, so the split between a strong industrial side and a flat services side is the thing to watch. Lagarde speaks Monday and Tuesday. Politics adds a small layer, with Chancellor Merz saying he will stay on after his party's worst ever result in a state election.
Price Levels
- Support: 1.1454 → 1.1418 → 1.1373
- Resistance: 1.1510 → 1.1558 → 1.1576
Technical View: The August triangle broke down in early September with a measured target near 1.1370, which coincides with third support. Price is holding the 1.1450 shelf with momentum stabilising just above oversold levels.
Outlook: Bearish bias. The breakdown target remains open, though stabilising momentum argues against chasing it lower from here.
.png?format=pjpg&auto=webp&width=1536&quality=75&branch=main)
WTI (USO/USD)
WTI trades near 100.62, back above the round number after dipping below it. The supply picture has shifted materially in a fortnight. Admiral Brad Cooper, head of US Central Command, said oil and LNG shipments through Hormuz have reached a six month high, with more than a billion barrels moved through the Strait in the last couple of months, and described momentum as building.
The risk has moved rather than disappeared. The Houthis reportedly attacked Saudi Arabia's East-West pipeline and forced it to shut, which Aramco has not confirmed, and that line exists precisely so Gulf crude can reach Europe without passing through Hormuz. Brent near $104 against WTI near $100 reflects where that risk sits. Softer crude has also been doing work elsewhere, capping the Dollar and giving gold room to recover.
Price Levels
- Support: 99.33 → 94.30 → 88.50
- Resistance: 102.50 → 107.05 → 109.50
Technical View: The late August breakout from the descending triangle off the May high ran to around 107 before the first real pullback. Price is now testing 99 to 100, the first support since the breakout, with little structure beneath until the 94 to 95 band.
Outlook: Two sided. Improving flows and pipeline risk point in opposite directions, and 99.33 is where the breakout is either confirmed or unwound.
_210926.png?format=pjpg&auto=webp&width=1536&quality=75&branch=main)
Nasdaq 100 (NDX100)
The Nasdaq 100 trades near 29,745, pressed against the ceiling of its range, with futures up 0.4% early Monday. Bloomberg strategist Mark Cranfield noted that a pro-business tone around the summit would encourage investors to read the index's inverted head and shoulders as the platform for an extended rally.
The structural question is concentration. Roughly 40% of the S&P 500's market value now sits in AI infrastructure companies, and AI accounts for nearly half of investment grade bond issuance this year, which is why large pension funds are finding their diversification increasingly illusory. The argument doing the rounds among asset allocators is straightforward: every infrastructure boom eventually builds enough infrastructure, and the only question is when this one does. In the meantime, stocks have become unusually sensitive to yields day to day, with the correlation now the most negative over a 200 day window since 1997, so Wednesday's PMIs matter here through the rate channel as much as the growth one.
Price Levels
- Support: 29,420 → 29,100 → 28,750
- Resistance: 29,760 → 29,950 → 30,250
Technical View: Since late August the index has traded between roughly 28,850 and 29,760, with repeated lows forming the base now being read as an inverted head and shoulders. Price sits at the top of that range, which also marks the underside of the rising trendline from May that broke in August.
Outlook: Constructive. The base is built and price is at the trigger, with Thursday's summit the most likely catalyst to clear 29,760.
.png?format=pjpg&auto=webp&width=1536&quality=75&branch=main)
Hang Seng (HK50)
The Hang Seng trades near 24,661 and carries the most direct exposure to Thursday. Groundwork talks between Scott Bessent and Vice Premier He Lifeng ran through Sunday in New York, covering trade and investment, AI, critical minerals and the Iran war, and He said an announcement would follow.
The market's base case is modest. Beijing has also pledged tougher scrutiny of what it called malicious price competition, aiming to shift companies away from price cuts toward product quality, which addresses one of the long running drags on Chinese margins. AI is the harder issue: Washington has threatened action over what it calls industrial scale distillation of American models, and Beijing has said it will retaliate if its AI companies are targeted.
Price Levels
- Support: 24,525 → 24,340 → 23,875
- Resistance: 25,000 → 25,200 → 25,800
Technical View: A short falling wedge into the mid September low near 24,400 carries a measured target near 25,800, which is third resistance. Price sits just above the 24,400 to 24,525 band and below the round 25,000.
Outlook: Rangebound. The wedge favours a recovery, but only a move back through 25,000 makes it active.
.png?format=pjpg&auto=webp&width=1536&quality=75&branch=main)
WTI (USO/USD)
USD/CHF trades near 0.8225 after briefly clearing 0.8250 last week, its highest since May 2025, and it is on track for a fourth straight weekly gain. The move has been driven by Franc weakness rather than broad Dollar strength.
The SNB is expected to hold at 0% on Thursday with Swiss inflation low, which leaves the rate gap with the Fed widening in only one direction. That gap is turning the Franc into a funding currency: as the BoJ normalises and Japanese rates rise, the Yen becomes less attractive for financing carry trades, and investors are increasingly selling the Franc instead. The press conference will be read for any sign the SNB is uncomfortable with that shift.
Price Levels
- Support: 0.8206 → 0.8153 → 0.8120
- Resistance: 0.8264 → 0.8300 → 0.8325
Technical View: Price is at the upper boundary of a rising wedge that runs from the May low near 0.7760, with the August triangle inside it already broken to the upside. Rising wedges at their upper edge are usually where advances tire, and the pattern's full projection sits far below near 0.7700.
Outlook: Bullish but stretched. Carry demand and the rate gap support the pair, but it is stretched at the top of its structure into Thursday.
.png?format=pjpg&auto=webp&width=1536&quality=75&branch=main)
Bitcoin (BTC/USD)
Bitcoin trades near 81,226 after rising about 6% on Friday, even as the Fed signalled further tightening. On chain data shows it has reclaimed the average cost basis of active market participants near 76,660, which is typically read as a return to a bullish regime, and the next reference levels are the corporate treasury cost basis near 80,421 and the US spot ETF cost basis near 85,638.
The zone above is crowded in both directions. A dense cluster of short positions has been building between 83,000 and 86,000, where forced covering could accelerate any move through it, but roughly 1.07 million Bitcoin also changed hands in that range, much of it now held by long term holders who may be happy to sell into strength. That makes 83,000 to 86,000 both the squeeze zone and the supply zone.
Price Levels
- Support: 79,900 → 77,600 → 75,500
- Resistance: 82,200 → 84,000 → 85,000
Technical View: The chart carries a potential double top, with Top 1 near 82,000 in early September and Top 2 forming near 81,500 now. The neckline sits near 75,500 with a measured target near 66,000, but the pattern is not active until the neckline breaks, and a close above 82,200 would invalidate it.
Outlook: Two sided. A bearish pattern on the chart meets bullish positioning above it, and 82,200 decides which wins.
.png?format=pjpg&auto=webp&width=1536&quality=75&branch=main)

Trade the Week Ahead
Explore our AI-powered Economic Calendar to stay ahead of market events.

Alexander Chieffalo | Eightcap Risk Manager
Alexander Chieffalo is Risk Manager at Eightcap.
Related articles

Trade gold CFDs 24/7 with GOLD247
Trade GOLD247, Eightcap's Gold/USD CFD, seven days a week.
17 August 2026

How does forex trading work?
New to forex? Learn how forex trading works in plain English, including currency pairs, price movements, CFDs, leverage and how to practise first.
17 August 2026

The six factors that drive Gold prices
What drives the price of Gold? Gold is considered to be a safe haven asset during periods of market volatility.
27 February 2020

