
How to read Candlestick charts in MetaTrader 4?

Charts are very important when it comes to efficient trading and interpreting market data correctly. Traders have the opportunity to use various charts and indicators that best suit their needs. Charts with a clear design and easy-to-read elements help the trader to take advantage of the rising trading opportunities on the Forex and CFD market. The most popular, found in MetaTrader 4 and in MetaTrader 5 is the candlestick chart.
This article will help you to utilize candlestick charts in MT4. You can also find it useful to take a look at the “How To Read A Candlestick Chart” article from the Eightcap’s “Trading 101” series.
This MetaTrader 4 tutorial will help you learn
- What are the candlestick charts;
- How to enable candlestick charts in MT4;
- How to recognize the elements of a candlestick;
- What is OHLC;
How to enable candlestick charts in MetaTrader 4
In MetaTrader 4, you can quickly switch between different types of charts from the Toolbar,
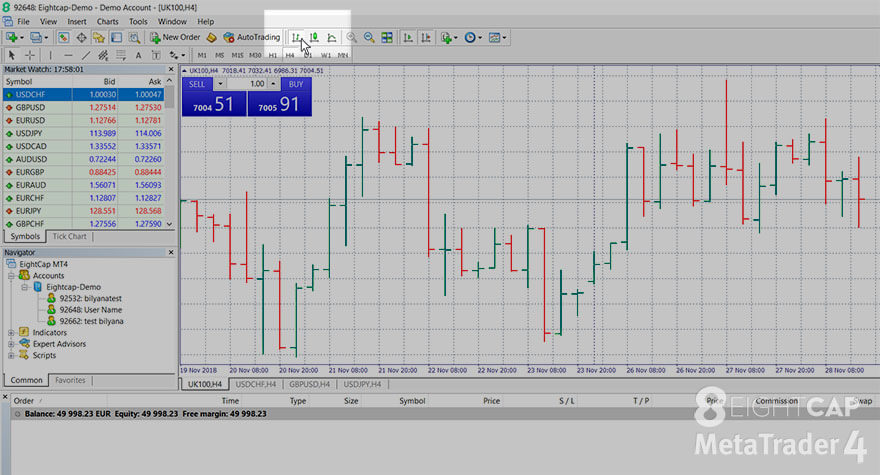
where you can find buttons for bar charts, line charts, and candlestick charts.
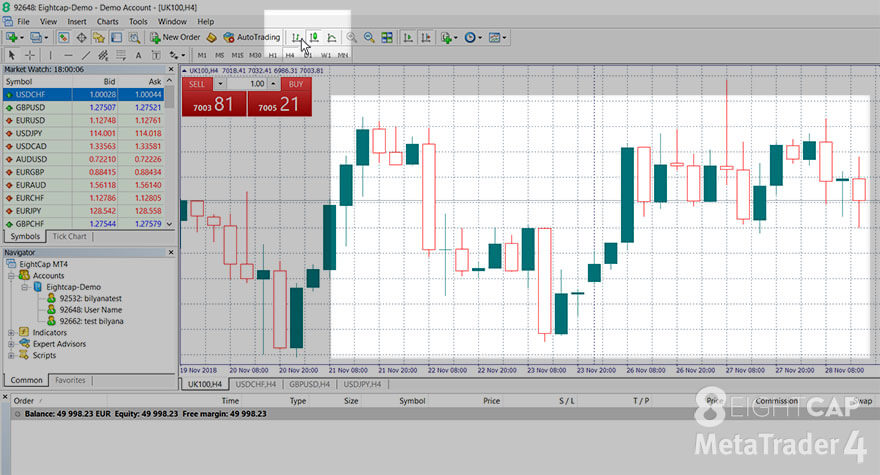
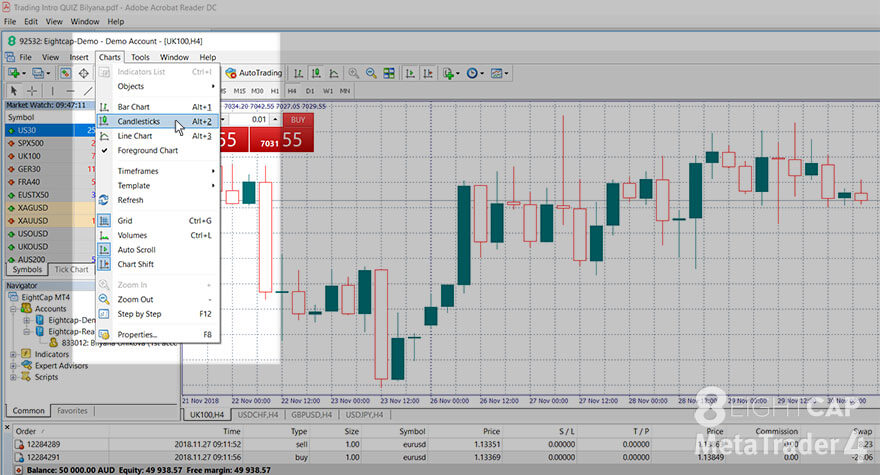
You can also switch between charts from the “Charts” main menu and you can use Alt+2 to open a candlestick chart.
How to recognize the elements of a candlestick
Candlestick body
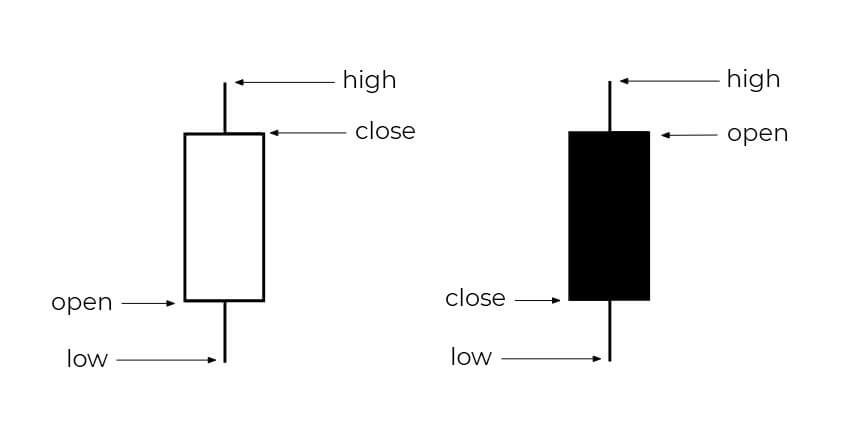
The “close” and the “open” indicate the opening and closing price of the asset for the period that the candlestick represents. If the chart is set to display a one-hour period, a single candlestick will represent the range between the opening and closing prices for one hour.
If the candlestick is hollow (displayed as white here), this means that the close is above the open. Having a closing price greater than the opening price points to buying pressure and makes the candlestick bullish. This means that the prices increased from open to close and buyers won the battle for that particular candle.
If the candlestick is filled (displayed as black), this means that the close is below the open. Having a closing price smaller than the opening price indicates selling pressure (more aggressive sellers) and makes the candlestick bearish.
The longer the body of a candlestick is, the bigger the buying or selling pressure. Short bodies imply greatly reduced buying or selling activity.
Candlestick shadow
They are called “shadows”. The shadows on the top show the session high and those on the bottom show the session low.
Candlesticks with long shadows are a good indicator that trading activity persisted well past the open and close.
How to read OHLC charts and candlesticks
Bar and candlestick charts illustrate the price action of an instrument over a certain period. They show the high, low, opening and closing price for each period (day, hour, minute etc) known as OHLC (Open High Low Close). This allows traders to understand the price’s movements in that period. Candlestick charts show a clearer presentation of the price in comparison to that of bar charts, but the price point data is the same as both represent an open, high, low and close. The body of a candlestick makes it easier for a trader to see if a period was bullish or bearish at a glance.
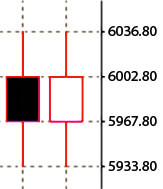
Let’s take some candles from the MetaTrader as an example of OHLC values. The filled (black) candle is moving down and the hollow one (white) is moving up.
Black candlestick: close is 5967.80, high is 6036.80, open is 6002.8, low is 5933.80
White candlestick: close is 6002.8, high is 6036.80, open is 5967.80, low is 5933.80
Trading on margin is high risk.