
Introduction to Trading Patterns

Introduction to Trading Patterns
The movements of asset prices often form recognisable patterns with fairly predictable outcomes. These patterns form when prices consolidate before either continuing in the direction of the trend or reversing the previous trend. With a bit of practice, chart patterns are easy to spot, allowing traders to quickly scan lots of charts to identify opportunities.
Chart patterns have specific rules regarding trade entry and the levels to use for profit targets and stop losses. Most patterns either signal a potential continuation or a reversal of the prior trend, however, some can lead to both depending on the direction in which they break out. All chart patterns can be bullish or bearish depending on the structure of the pattern and the direction of the prior trend.
Traders may prefer to use one pattern over another but they all vary slightly to show different trends for a certain asset class.
There are some patterns listed below that are more suited for a volatile market, bearish market and bearish market so you can identify which one is suited which particular asset class you want to trade.
Reversal Patterns
The Head and Shoulders is perhaps the most widely known chart pattern. It is also the most recognisable and one of the most reliable patterns to trade.
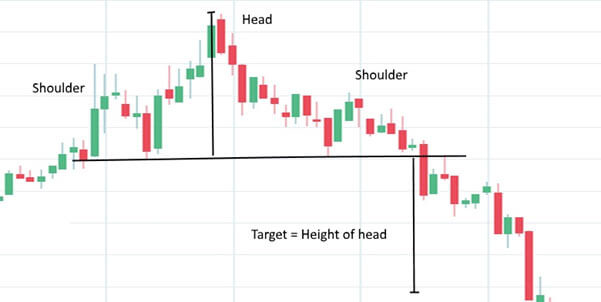
Head and Shoulders Pattern
After forming a higher high, the price falls all the way back to where that high began. It then makes a lower high and falls back to the same level, forming a neckline and completing the pattern. A short trade is triggered when the neckline is broken. The target is the height of the head (the middle peak) and the pattern fails if the high of the right shoulder is breached.
An upside-down, or inverse head and shoulders is a bullish pattern that occurs after prices have fallen.
Other examples of reversal patterns
- Double tops (bearish) and double bottoms (bullish)
This is when the price of a certain asset will hit a peak before falling back to the support level. However, the price level will climb once more before reversing back against the current trend. - Triple tops (bearish) and triple bottoms (bullish)
- Rising wedges (bearish) and falling wedges (bullish)
- Rounded bottoms (bullish)
- Cup and Handles (bullish)
Continuation Patterns
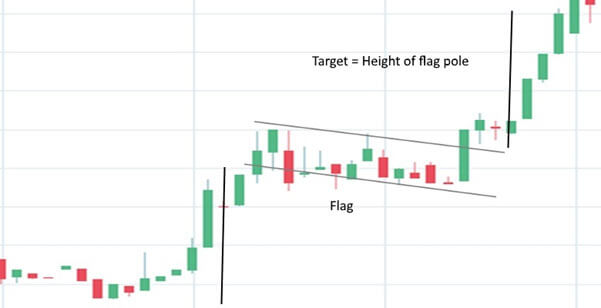
The bullish flag represents a neat consolidation pattern that occurs in an uptrend. Prices form a neat channel that gradually drifts lower. The pattern is triggered when the price breaks the upper channel with a target the same height as the up move preceding that flag. A stop loss should be placed below the lowest point of the flag. A bearish flag will occur in a downtrend.
Other continuation patterns include:
- Pennants
- Symmetrical triangles
- Ascending triangles and descending triangles
An example of a trading strategy using a chart pattern
The example below is an example of a bullish falling wedge. This pattern occurs when the price moves lower while volatility falls. Eventually, the price becomes oversold and prices move higher just as volatility picks up.
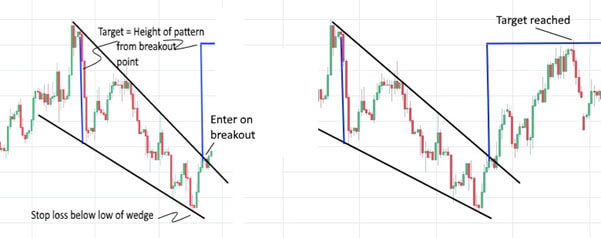
The entry is triggered when the price breaks the upper edge of the wedge. The target is calculated by adding the height of the pattern to the breakout point. If the price breaches the low of the wedge the pattern has failed and any trades could be closed for a loss.
These patterns appear all the time in every market and in every time frame. Future tutorials will cover each pattern in detail along with a strategy to trade each pattern.
To find out more about technical indicators read our guide here.
Gain access to over 200 financial instruments with Eightcap, try our free demo trading account today.
Trading on margin is high risk.