
Trading with the Trend

Trading with the trend is favoured among traders as it allows them to make the most out of momentum in the markets. If you are new to trading, you can look at trading in the direction of the trend as a starting point.
What is trading with the trend?
Trading with the trend falls under technical analysis and uses indicators to determine the direction the market is moving in.
If you focus on trading with the trend, you will be trading with the dominant market direction.
Trades can either be made in the direction of a trend or counter to the trend. While countertrend, or mean reversion, trading can be very profitable it generally requires more experience.
In this guide, you will learn how to trade with the trend by determining what the trend is for a certain financial asset and how you can indicate when a trend could come to an end.
Why is time frames important when trading the trend?
When following price movements in long-term investments of a financial asset, you will tend to analyse a term frame covering a long period compared to short-term time frames. If you are an intraday trader you will prefer to use a shorter time frame. Time frames will really depend on your trading style and therefore you will need to determine this before you start to trade with the trend.
How do you identify a trend?
The reasoning behind trading the trend strategies is so that you are able to determine which the market is moving and exit your position before it reverses. In order to identify the trend you need to look at:
- Opening and closing prices of the financial asset
- The range of the candlesticks on the asset’s price chart
If the market value of a particular financial asset is increasing then this is known to traders as an uptrend. To trade an uptrend, normally you would open a long position in order to try and take advantage of the high price levels. Similarly, when a financial asset is depreciating in value it’s known as a downtrend. In this case, you would normally open a short position. If a price isn’t revealing high or low price levels this is then known as trading sideways.
Trading retracements using two moving averages
This is one of the simplest strategies around. All that’s required is two moving averages and an RSI. The chart below is a 4-hour candlestick chart of the GBP/USD currency pair with a 15 and 30-period moving average. The RSI is plotted below the price chart.
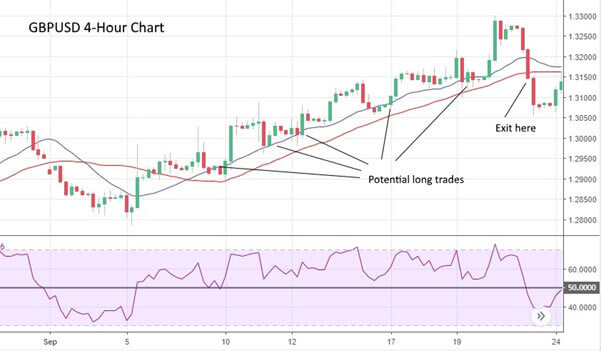
The strategy is very straightforward. For long trades, wait for the shorter moving average to cross above the longer moving average. Both averages should be heading higher and the price should be above the short moving average. Now, wait until the price falls below the short average but stays above the longer average. This is the setup. Before entering wait for the price to cross back above the shorter average and close above it. Finally, check that the RSI is above 50 and then enter a long position. You can hold the position until the price closes below the longer moving average, or you can exit if the price reaches an obvious resistance level like a previous high.
For short positions do the exact opposite and remember to check that the RSI is below 50 before entering a position. This strategy can be used on any time frame and in any market – but if you are day trading make sure there is enough time left in the day for the trend to continue. You can also use different combinations of moving averages if you find they fit the price action.
Trading with tests of the trendline
To trade this strategy, you will need to first wait for a clear trend to develop.
For an uptrend, you’ll want to see at least two higher highs and two higher lows. For a downtrend, you’re looking for at least two lower highs and lower lows.
Once you have identified the beginning of a trend you can draw a trendline. For uptrends it must touch the bottom of the two lows – this line will potentially act as support. For a downtrend, it will touch the top of the two highs and act as resistance. As a trend develops the price will often test and then either reject or break the trendline. This strategy aims to trade when a trendline is tested and rejected.
The chart below is again a 4-hour chart of the GBP/USD pair with a trendline touching the first two highs. The inset is a 60-minute chart. The trend is down, so in this case, you would be looking for a short trade.
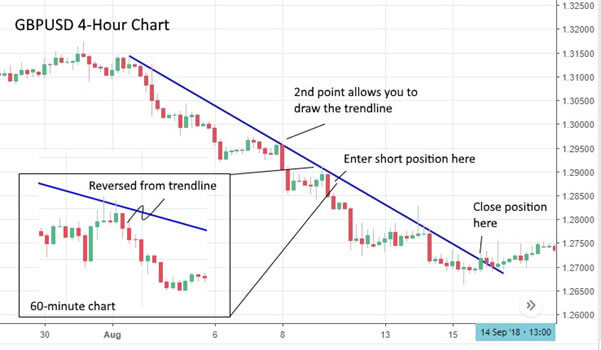
Once you have the trendline in place, wait for the price to move back towards it. Once it begins to do so you can zoom into a lower timeframe of 20-30% of the original timeframe. Now look for the price to touch or come very close to the trendline and then move away sharply. Ideally, it should reverse with a candle that’s bigger than the candles before it. Wait for the next candle to open and if it continues moving in the same direction you can enter a short position.
Your stop loss is the highest high of the last few candles and you can hold the short position until the price closes above the trendline. For long positions, you will be looking for a bullish reversal off the trendline and hold the trade until the price closes below the trendline.
Summary
These are just two of many strategies you can use to trade in the direction of a trend. Losses will generally be small, and you will have the momentum of the trend behind you, making for good risk-reward ratios. It’s important to only take clear, unambiguous setups when the market is decisively trending. If the market is choppy, be patient – a better trade will come along.
Trading on margin is high risk.