
How to Trade with an RSI Indicator

What is the RSI Indicator?
The RSI is also known as the Relative Strength Index and is used by traders as a form of technical analysis. This oscillator helps traders to identify momentum on price charts as well as informing them of overbought and oversold market conditions. The indicator will also help identify divergence for financial assets.
Calculation of The Relative Strength Index
You probably won’t ever need to calculate the RSI yourself, but it’s useful to know how it is derived. The RSI indicator compares the size of average positive price movements and average negative price movements over the period being studied. There are three steps to calculating the indicator.
First, the average gains and losses are calculated over a number of periods being studied:
- Average gain = Sum of all positive price movements over the last n periods/number of positive movements in last n periods.
- Average loss = Sum of all negative price movements over the last n periods/number of negative movements in last n periods.
Next, the two are compared by dividing the average gain by the average loss:
RS = Average Gain/Average loss
Finally, the result is normalised using the following formula:
RSI = 100-(100/1+RS)
The result is an index that oscillates between 0 and 100, climbing when the ratio between average gains and average losses rises and falling when the ratio falls.
6 Different Ways You Can Use the RSI
The RSI can be used in several ways as you will see below. However, it should almost always be used with other indicators like moving averages or a MACD, and not in isolation. The RSI can also be used as a tool to help you confirm or time entries and exits.
Simple Confirmation for Trade Entries
Very simply, an RSI can be used to confirm trade entries for other strategies. If you are entering a long position based on moving averages, trend lines or a MACD indicator, you can wait for the RSI to cross above 50 to prove there is some momentum behind the price. Likewise, for short trades, you can wait for the RSI to fall below 50.
Overbought and Oversold
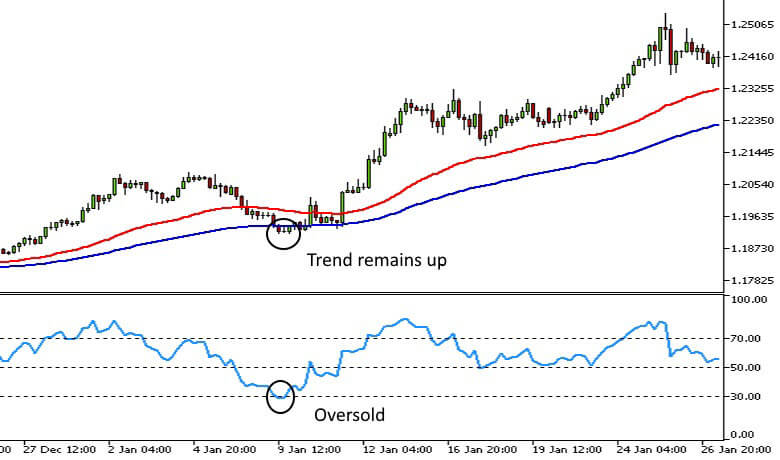
The RSI is one of several oscillators that traders use to identify overbought and oversold levels. Prices become oversold when the RSI falls below 30 and overbought above 70.
The following 4-hour chart of the EURUSD pair shows how an oversold RSI reading. It is also combined with 50 and 100-period moving averages offered a profitable entry point within the uptrend.
Exiting Trades
An RSI can help you time your exit for positions that have been entered using other methods. For long positions, you can wait for the RSI to rise above 70, and then exit as soon as it drops back below 70. This will help you exit your position when the price is overbought and momentum is showing signs of slowing. For short positions, you would wait for the RSI to fall below 30, and then rise back above that level.
The following chart illustrates how well this method of exiting a trade can work.

Divergence
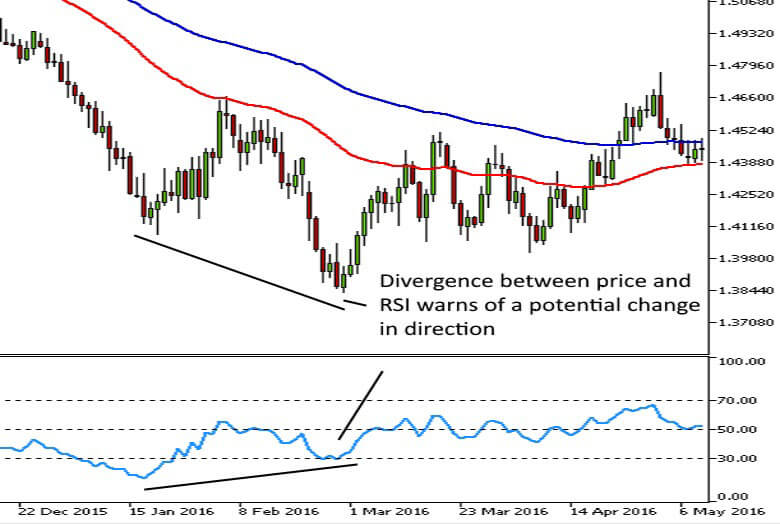
Like most oscillators, an RSI can be used to warn of pending reversals or retracements. If the price makes a higher high, while the RSI makes a lower high, a bearish reversal or retracement might be developing.
If the price makes a lower low but the RSI makes a higher low, prices may soon rise. An example of this is shown on the following daily chart of GBPUSD. Divergence does not indicate exactly when the move will occur, or its magnitude. Price action needs to be watched carefully for confirmation.
RSI trendlines
Trend lines can also be drawn on the RSI indicator, with a break of the trend line indicating a change in the direction of momentum. Trend lines on the RSI and price chart can also be combined. If trend lines on both the RSI and price are broken there is a higher probability of the price following through, than if only one is broken.
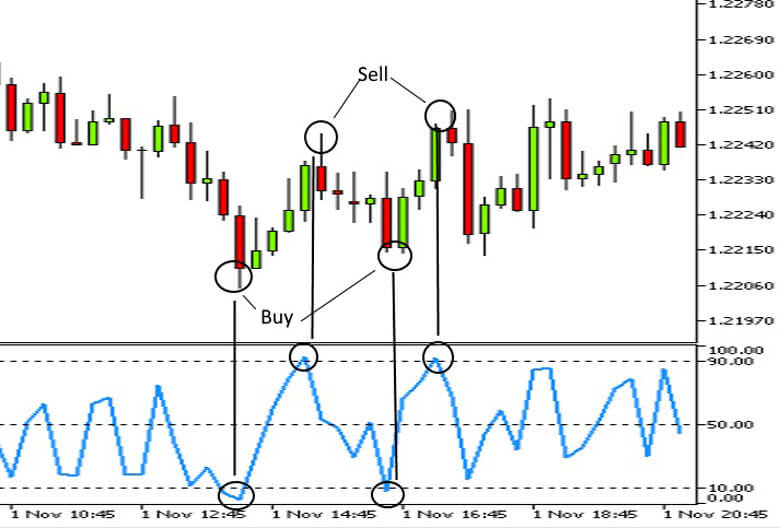
2-Period RSI
Scalpers and short-term counter-trend traders often use a 2-period RSI to identify extreme price moves. They will usually use more extreme levels like 90 or 95 for overbought and 10 or 5 for oversold. Trades are then entered in the opposite direction of the move. Positions are exited once the RSI crosses above or below 50, or when the price reaches the midpoint of the trading range. Tight stop losses need to be used with this strategy as these trades don’t always work out. Extreme moves can also persist for some time. The following 15-minute chart for GBPUSD illustrates how this can be applied.
Conclusion
As you can see, the RSI is a very versatile indicator. It can be used for so many purposes, including replacing several other indicators, leading to an uncluttered chart layout. However, it should not be used in isolation and is best used with moving averages, trend lines, or a MACD indicator. Find out more about trading the financial markets with Eightcap’s free demo trading account or create a live account and start trading with as little as $100.
Trading on margin is high risk.