
How to trade with Bollinger Bands

What are Bollinger Bands?
Bollinger bands form another key part of technical analysis. This indicator can be adjusted by the trader is used to generate overbought and oversold signals. Bollinger bands are composed of three lines: the simple moving average and the upper and lower bands.
The bands are plotted by:
- calculating the standard deviation of price movements over the last N trading periods, and then
- plotting a band X number of standard deviations above and below an N period moving average.
The bands are usually calculated for 15 or 20 periods, using 1 or 2 standard deviations.
Prices will usually stay within one standard deviation of the mean 60 to 68% of the time and within two standard deviations 88 to 95% of the time. This means that when the price crosses a band, it either means a new trend is starting, or that a reversal is likely.
The following are a few common strategies that use Bollinger Bands to identify trading opportunities.
Walking along the Bands
During strong trends in both directions, prices will often ‘walk along’, or stick to, the upper or lower Bollinger Band. If the price breaks above the top band, or below the bottom band and then straddles the band for one or two consecutive bars, there is a very good chance the trend will persist.
The following hourly chart of the USDCHF pair illustrates how persistently prices can stick to the lower band in a downtrend.
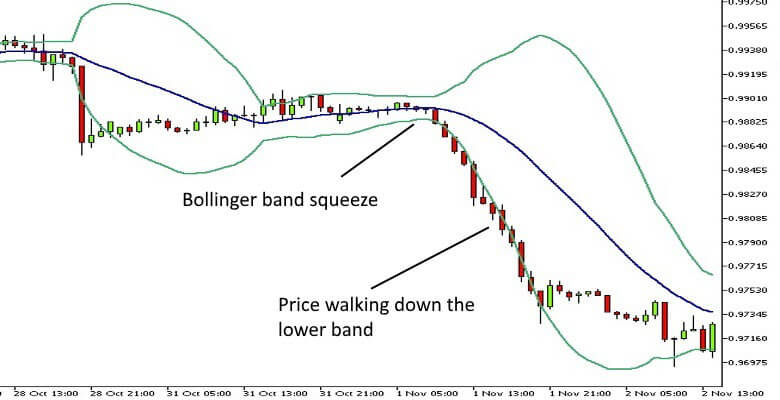
Bollinger Band Squeeze
The above chart also illustrates a Bollinger Band squeeze. The movement of prices tends to oscillate back and forth between periods of high and low volatility, regardless of the direction prices are moving in. When volatility falls, the gap between the bands narrows. This warns of a potential large move, even though the direction may not be clear.
To trade a squeeze like this, you wait until the bands are far narrower than usual, then wait for the price to break out of the bands in either direction. You then enter a trade in the direction the price is moving as long as volume is reasonable. This should be executed as a momentum trade with a trailing stop to protect profits. You can stay with the trade as long as the momentum continues.
Three Pushes to a High or Low
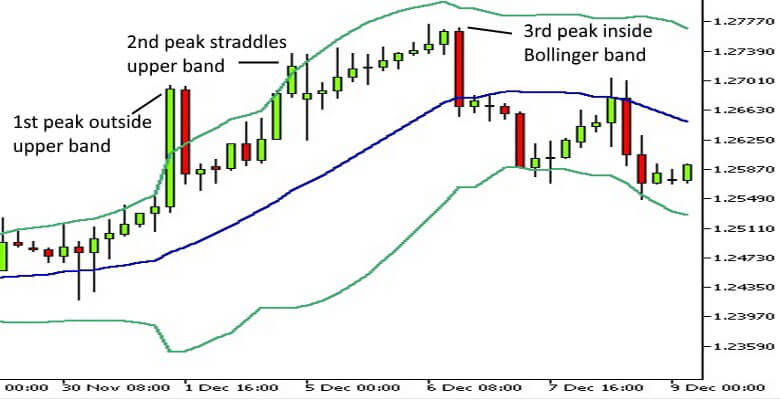
This is a very easy pattern to spot and can alert you to the likely end of a trend. During an uptrend the price will first make a new high outside of the bands, then a second higher high very close to the upper band. Finally there will be a third new high inside of the bands. When this occurs, there is a very good chance the market will retrace – usually to the lower band and even lower. The opposite applies to downtrends with three new lows being made before prices begin rising.
This pattern will often be accompanied by the divergence between the price and indicators like an RSI or MACD. The below 4-Hour chart of the GBPUSD pair illustrates this pattern during an uptrend.
Double Tops
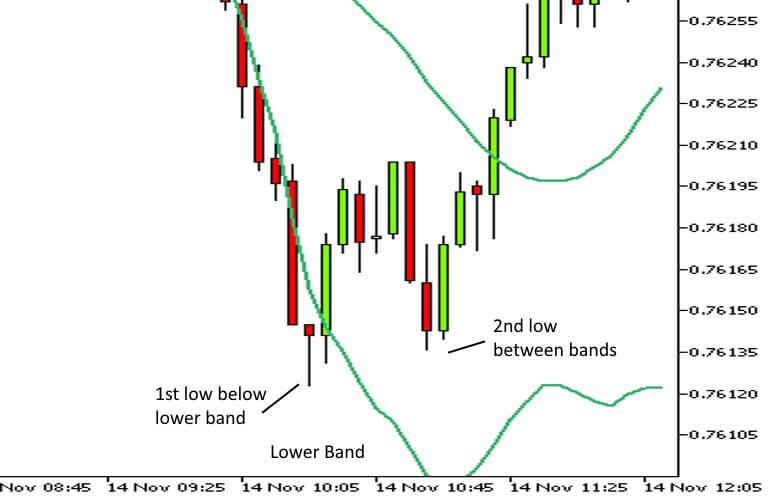
While double tops and bottoms can be traded on their own, when combined with Bollinger Bands they can be more reliable. If a peak or trough that forms outside the bands, is followed by another peak or trough that is inside the bands, there is a very good chance that a reversal is occurring.
The second high or low does not have to be exactly equal to the first one. But it should fall between the moving average and the upper band for tops, or between the moving average and the lower band for bottoms. The following 15-minute chart of the AUDUSD shows a double bottom that was followed by a substantial rally.
Scalping
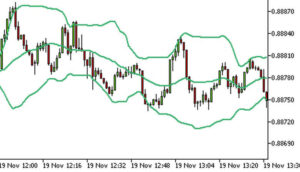
Bollinger bands are a useful tool to scalp when there is no discernible trend and prices become rangebound or consolidate. This strategy works best on shorter time frames and during quiet periods of the day when there is no news flow and volumes are low. It’s important to remember that all trading ranges eventually end, with prices often breaking the range very suddenly. So, tight stop losses are required and should always be observed.
The following EURGBP 1-minute chart shows several scalping opportunities.
Conclusion
As you can see, Bollinger Bands can be used in a wide variety of ways. Most experienced traders develop their own methods to use them. Bollinger Bands tend to suit different styles of trading depending on the asset and time frame being traded. If you spend some time watching the relationship between the price and the bands for a particular instrument you should begin to recognise patterns that you can use to develop your own strategies.
Trading on margin is high risk.