
How to Trade with Fibonacci Levels

About the Fibonacci Sequence
The name “Fibonacci sequence” was first used in the 19th-century. The sequence is known since ancient times. It was first expressed by Indian author Pingala but got its name after the mathematician Leonardo Bonacci of Pisa.
The Fibonacci sequence consists of a series of numbers starting from 0 and 1, with each number being the sum of the two preceding numbers.
The unique feature of this sequence is that the ratio of each number to the number to the right of it is fairly consistent and approached 61.8% as the numbers get larger. The ratio of each number to the number two places to the right of it approaches 38.2%. To the number three places to the right of it approaches 23.6%.
Moving from right to left, each number is approximately 1.618 times the number to the left of it, and 2.62 times the number to places to the left.
How do they apply to trading?
Fibonacci ratios are used to calculate the percentage of a price move that might retrace, or to calculate how much further a trend might extend beyond a previous high or low.
The 23.6%, 38.2% and 61.8% percentages, along with 50%, are commonly used by traders to determine a price level where a retracement may end. The 61.8%, 100%, 161.8% and 262% levels are used to find profit targets.
Because ‘Fib levels’ are watched by so many traders, prices often react at major Fib levels. If these Fib levels coincide with previous swing highs and lows, trend lines, or major moving averages, there is even more chance the price will reach those levels and then react in some way.
Fibonacci Retracements
The following hourly chart for the EURUSD pair shows a retracement within a downtrend. As you can see the price reversed and the downtrend continued when exactly 61.8% of the initial downtrend had retraced.
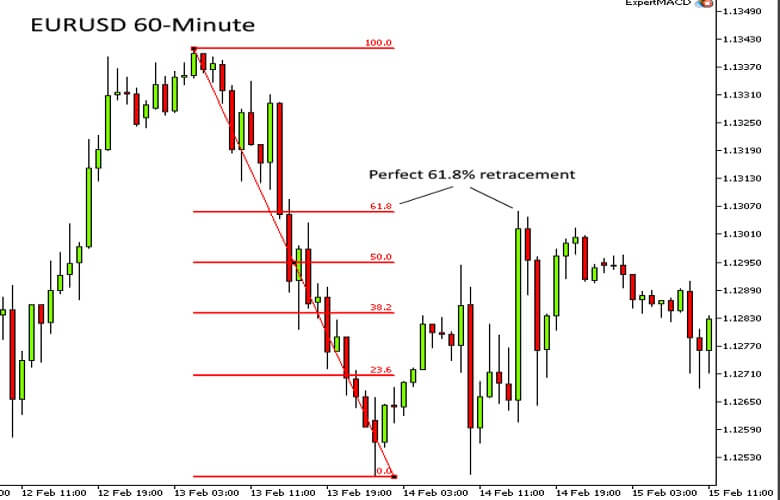
Retracements most typically end when the prices have retraced between 50% and 61.8%. This zone is often referred to as the ambush zone.
Shallow corrections often reach a 23.6% or 38.2% retracement. It tends to occur during strong trends when the correction takes the form of a flag or pennant.
Fibonacci Extensions
Fib numbers can also be used to identify potential targets if a price breaks a previous high or low after a retracement has occurred. A Fib extension, or expansion, is measured as a percentage of the directional move that occurred before the retracement.
The chart below is the GBPUSD pair on a daily timeframe, with a strong trend to the upside. After moving from A to B, the price retraced 50% of that move (to C) before reversing higher again.
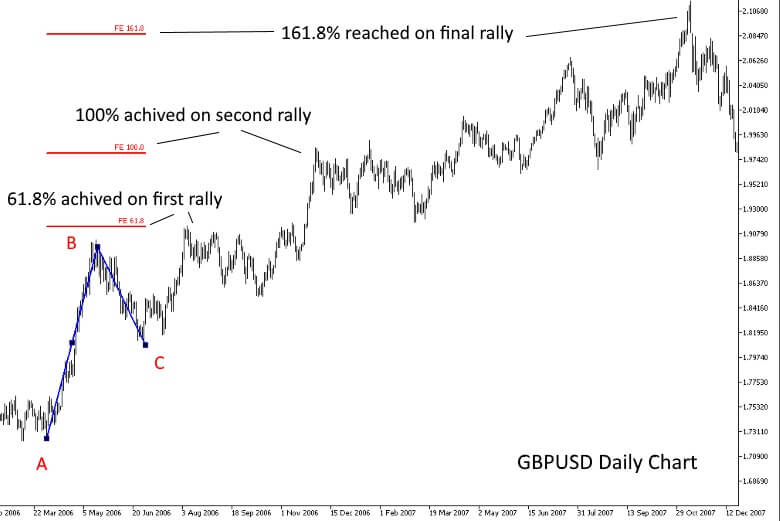
If you had opened a long position you would have probably wondered where you should exit the trade.
Potential targets can be set at a price equal to C plus the following Fib percentages of the move from A to B: 61.8%, 100%, 161.8% and 262%.
An initial rally will usually take the price to the 61.8% level which often coincides with the swing high at B. If there is sufficient buying volume the next move will usually end close to 100%, which will mean the rally from C is now equal to AB.
If momentum is really strong and buyers continue to enter the market, the price may reach 161.8% and 262%. These targets will often coincide with smaller Fib extensions calculated from subsequent retracements.
Conclusion
Fibonacci ratios do not necessarily work because of the maths behind the sequence. In fact, it’s more likely that they work because so many traders watch them. The point is that regardless of why they seem to work, they are important levels for traders to watch.
Fib levels can be used on their own to find potential entry and exit points. However, they are usually used in conjunction with momentum indicators, trend lines and moving averages. They are also a key component of Elliott Wave analysis.