
What is a moving average and how do I use it?

What is a Moving Average?
A trader will calculate a moving average in order to determine and the constant average price that is always updated and accurate. By calculating the moving average you avoid random fluctuations in price. You will be also able to see the direction of the trend and identify the support and resistance levels of the financial asset.
Moving averages always need to be considered in the context of market structure. They can give an indication of short, medium and long-term trends. This depends not only on the length of the MA but on the timeframe being observed. There is no magic length for a moving average. You can either stick to parameters that make sense to you or find parameters that suit what you require for the chart you are examining.
If you have a long time period for the moving average then this probably will mean that there is more of a lag. For example, if you had a time period going over 100 days it would have more of lag than if you had a time period of 10 days. Traders commonly use 15, 20, 30, 50, 100 and 200 day time periods for determining moving averages. However, it is important to note that moving averages are a completely customisable technical indicator. The average will be sensitive to price fluctuations and even more so if it was used during a short time period.
They are more relevant to shorter averages, and for more than 50 periods a simple moving average usually suffices. The 20-EMAs are specifically useful for the Bladerunner strategy.
How to Use It?
As an analysis tool, there are three ways moving averages can be used to define a trend. Firstly, you can use the direction of the MA. If it’s pointing up, the trend is up, and if it’s pointing down, the trend is down. Secondly, you can determine whether the price is above or below the moving average. Then you can use that as an indication of the trend. Finally, you can use two moving averages of different lengths. When the shorter one is above the longer one, the trend is up, and when it’s below the longer MA, the trend is down.
You should explore the different time frames and figure out which one works best for you. Below we run you through different types of moving averages. To practise trading the financial markets try Eightcap’s free demo trading account, gain access to over 200 financial instruments with $100k in virtual funds.
Simple Moving Average Cross-overs
Moving average crossovers are a straightforward way to use two MAs to define trends. Simply buy when the shorter MA crosses above a longer MA and sell when the shorter MA crosses below the longer MA. Some traders use this approach to maintain a long or short position at all times. Others use it to switch between a long position and no positions.
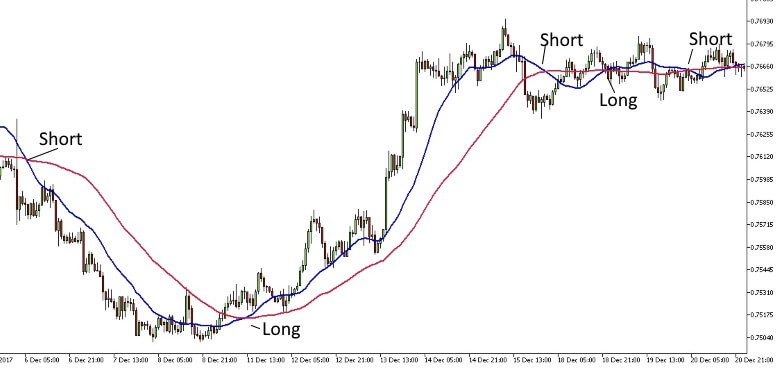
This method does have some drawbacks. While it is profitable when there are strong trends, during periods low volatility rangebound markets, trading it will often generate false, unprofitable signals. The following hourly chart of AUDUSD illustrates two very profitable trades, followed by a number of false signals.
Momentum Trades with the Trend
A better approach is to use other indicators and techniques to enter trades in the direction of the trend, using moving averages to define the trend, but not to time entries. There are several ways to do this and several indicators, including a MACD, Stochastics and RSI can be used.
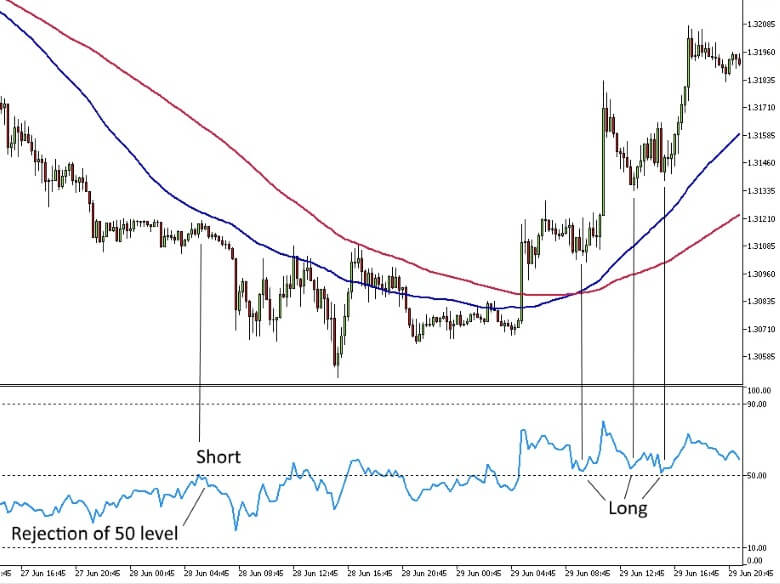
An example using the RSI is illustrated below on a 15-minute chart of the GBPUSD pair. To use this technique, you use the moving averages to define the trend, and then enter trades in the direction of the moving average when the RSI rejects the 50 level. Positions can be held until the price crosses the longer moving average, or a trailing stop can be employed.
Buying and Selling the First Pull Back
Another simple technique is to buy or sell the first price retracement after one moving average has crossed another. For long trades, make sure the shorter MA is above the longer MA and the price is above both MAs. Then the trader will wait for the price to retrace between the two MAs. When it crosses back above the shorter MA they enter a long position. Use the lowest price of the retracement as an initial stop loss and hold the position as long as the price remains above the longer moving average. Simply do the reverse to enter a short position after a retracement during a downtrend.
Tripple Moving Averages
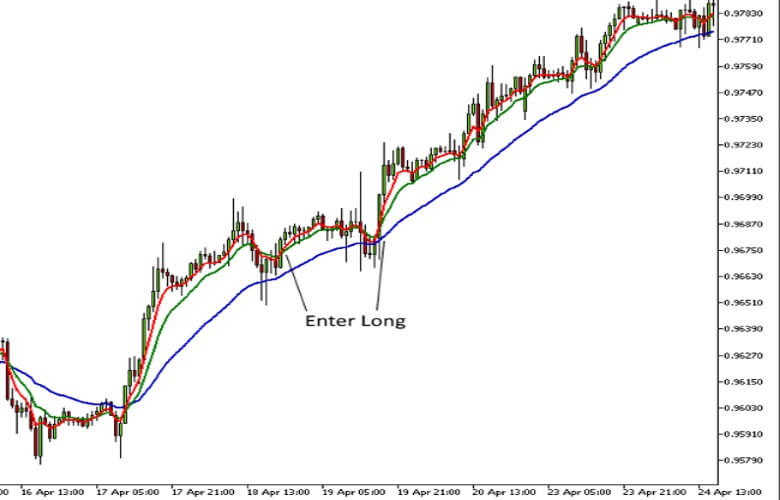
Another simple strategy is to use three moving averages. The two longer averages are used to define the trend and the shorter average is used to time your entries. You can use a 5, 10 and 30 period EMA, or any similar combination preferred on the chart you are trading.
When the middle average is above the longer average you are only looking to enter long positions. When it’s below the longer average you are looking to enter short positions. If the trend is up, you wait for the short EMA to cross below the middle EMA, and then cross back above it before entering a long position and if the trend is down, you wait for the short EMA to cross above the middle EMA and then cross back down before entering a short position. You can hold the position until the middle EMA crosses the longer EMA.
The following USDCHF hourly chart with a 5, 10 and 30 periods EMAs illustrates two very profitable opportunities provided by this strategy.
Using the 200-day Moving Average to Define Long-Term Trends
The 200-day simple moving average is widely used as a gauge of the primary trend for stocks and equity indices. Its often used for other markets including forex and commodities. Quite simply, an asset is said to be in a long-term bull trend when the price is above its 200-day simple moving average, and in a bear trend when it’s below the average.
Conclusion
As you can see there are several ways to use moving averages to guide your trading. They’re very easy to use and apply and can help you identify trading opportunities, provided prices are trending. It’s important to consider the bigger picture. Be cautious if prices show signs of consolidation or rangebound action. This can result in moving averages losing some of their effectiveness.
Trading on margin is high risk.