
How to Trade with Stochastic Indicators

Calculation and Parameters
However, it is useful to know what it actually indicates. Two lines are usually shown, a faster %K and a slower %D, which is usually a 3-period simple moving average of the %K line. The slower line is used as a signal line. Signals are generated when the %K line crosses the %D line.
The %K line is calculated with the following formula for the period being observed (usually 14 periods):
%K= (Current Close – Lowest Low)/ (Highest High – Lowest Low) * 100
The stochastic indicator shows you in percentage terms where the price is relative to its range over the lookback period.
The parameter is usually set to 14 periods, though some traders adjust that to between 5 and 21 periods. The following are three ways the stochastic indicator can be effectively used in your trading.
As an Overbought or Oversold Indicator
Stochastic indicators are most typically used to indicate that the market is overbought or oversold. Like the RSI this depends on the context, as the price can continue to rise when overbought and fall when oversold.
For this reason, it’s best to use trend indicators like moving averages and the MACD to define a trend first, or Bollinger Bands to define a trading range, and then once you have decided on the direction you will trade you can use the stochastic indicator to identify overbought or oversold levels.
Usually when the stochastic is above 80 it is regarded as overbought and below 20 it’s regarded as oversold; however, some traders will use 70 and 30 as appropriate levels. Signals are generated when the faster %K line cross the %D signal line. The following example illustrates a short trade opportunity identified by combining moving averages and stochastic indicators.
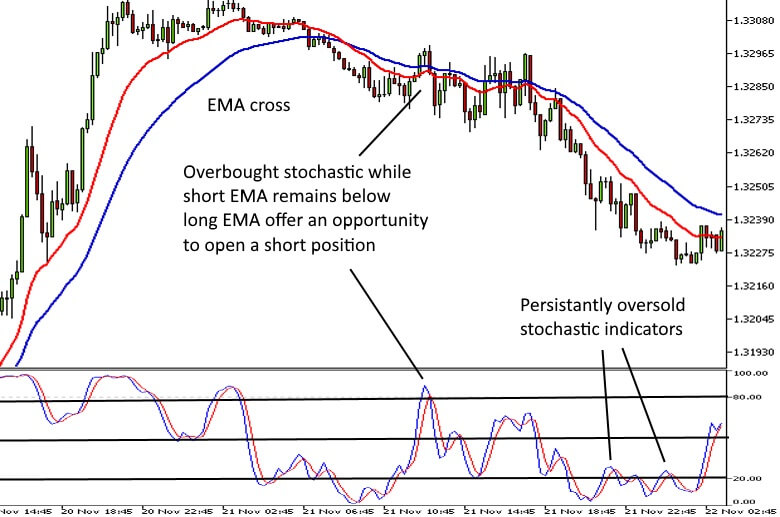
Persistent Overbought or Oversold Stochastic
During strong trends stochastic indicators can remain overbought or oversold. If the stochastic indicators rise above the 80 level and do not cross back below 80 within a few bars, there is a good chance the price will continue to rise. The example above shows how the price continued to fall as the indicators bounced around the 20 level.
This strategy can be used to add to positions, as a sign to hold a position a little longer, or as a signal to enter a new trade.
Momentum trades with a Stochastic Oscillator
Some interesting trading strategies can be developed by altering the parameters of the stochastic oscillator. By using a longer period for the slow stochastic, or a shorter period for the fast stochastic the two lines can be used to identify high probability momentum trades in the direction of the trend.
The following hourly chart is the USDJPY pair with a fast stochastic that has been set to 5 and a slow stochastic that has been set to 17. You can use a moving average or trend lines to indicate the direction of the trend.
The idea is to use the slow stochastic (red line) to confirm that momentum is headed in the same direction of the trend. Then use the fast stochastic (blue line) to identify entry points.
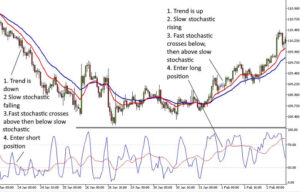
If the slow stochastic and trend are both sloping up, you wait for the fast stochastic to cross below the slow line, and then cross back above it. When it does this the slow line must continue to rise.
If momentum and the trend are falling, you wait for the fast line to cross above and then back below the slow line, while the slow line continues lower. These trades can be held until the trend is broken.
The settings for trades like this can be adjusted to suit the instrument or time frame being traded. By doing so you can create unique trading strategies of your own.
Other Applications
There are several other ways stochastic indicators can be used. They can be effectively combined with Bollinger Bands to scalp when the market is rangebound or consolidating. Divergence between stochastic indicators and price can also be used to warn of potential retracements and reversals, just like an RSI or MACD. The stochastic can also be combined with a MACD to create a momentum or trend following strategy.
Conclusion
Despite being one of the oldest widely used technical indicators, stochastic indicators remain popular and effective. By adjusting the parameters, they can also be used to spot patterns unique to each instrument. As such they are commonly used to build unique trading strategies and even automated trading robots.