
Candlestick Formations – A Comprehensive Guide

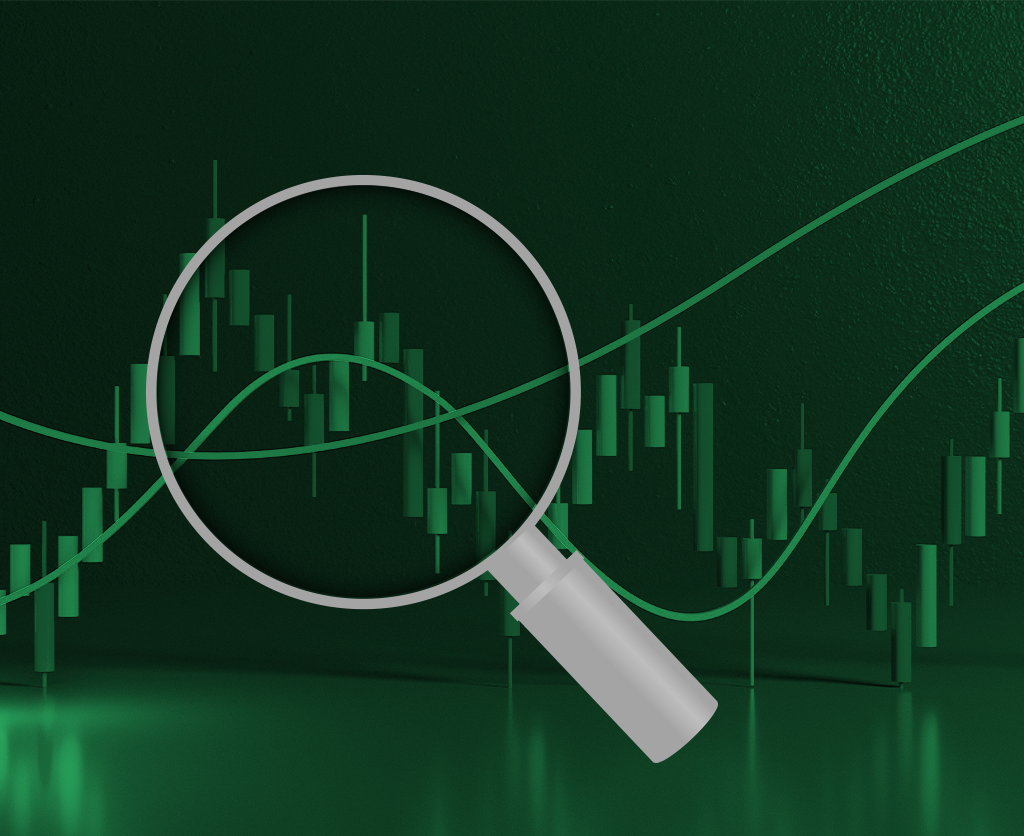
Candlestick formations are one of the most popular and widely used tools in technical analysis for CFD (Contract for Difference) trading. Developed centuries ago by Japanese rice traders, candlestick charts provide valuable insights into market sentiment and price action. By understanding candlestick formations, traders can gain an edge in predicting market trends and making informed trading decisions. This article will explore the significance of candlestick formations in CFD trading and discuss some of the most common and reliable patterns.
What are Candlestick Formations?
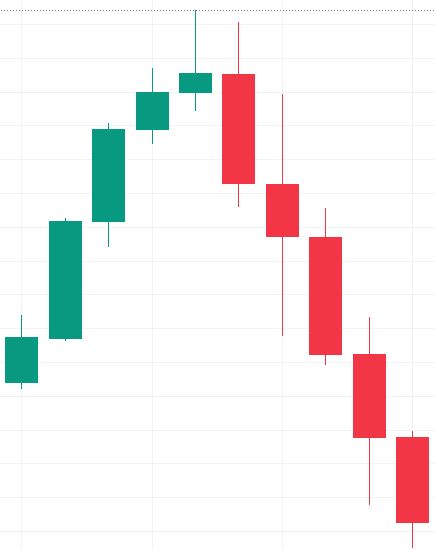
Candlestick formations are graphical representations of price movements within a specific time period on a candlestick chart. Each candlestick consists of a body and two wicks, also known as shadows. The body represents the opening and closing prices, while the wicks represent the high and low prices during the selected time period. By analyzing candlesticks’ shape, size, and position, traders can potentially decipher market psychology and identify potential reversals or continuations in price trends.
Basic Components of a Candlestick
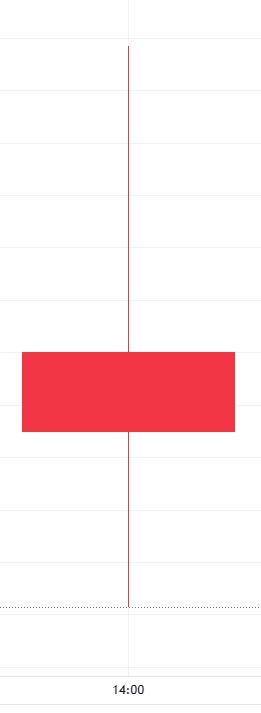
a) Body: The body of a candlestick represents the price range between the opening and closing prices. If the closing price is higher than the opening price, the body is typically filled or colored green, indicating bullish or positive sentiment. Conversely, if the closing price is lower than the opening price, the body is usually hollow or colored red, indicating a bearish or negative sentiment.
b) Wick: The wicks, also known as shadows or tails, represent the range between the high and low prices during the selected time period. The upper wick extends from the top of the body and indicates the highest price reached, while the lower wick extends from the bottom of the body and represents the lowest price reached.
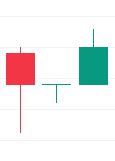
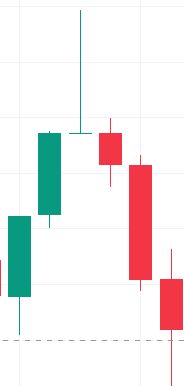
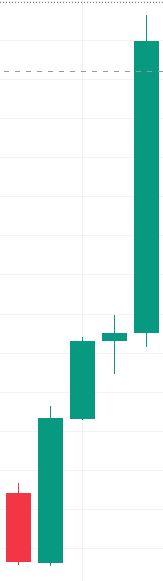
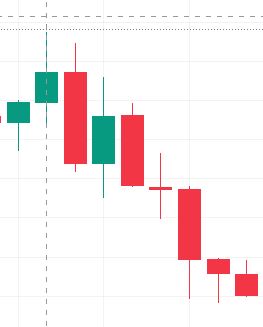
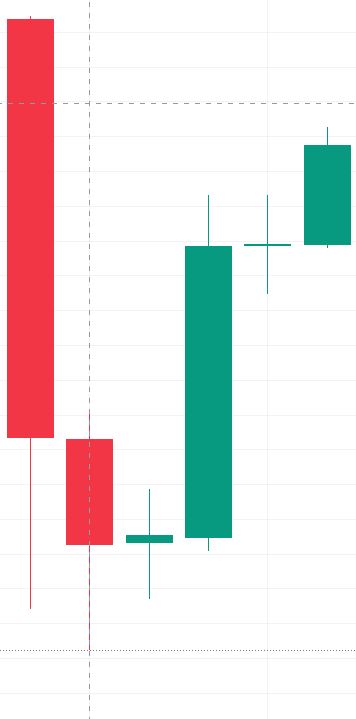
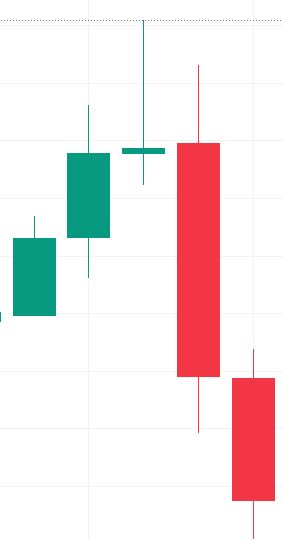
Common Candlestick Patterns
Let’s delve into greater detail and explore some examples of common candlestick patterns in CFD trading.
a) Doji: A Doji candlestick pattern is characterized by a small or nonexistent body, indicating that the opening and closing prices are very close or even identical. This pattern suggests market indecision and potential trend reversal.
There are different types of Doji patterns:
Long-legged Doji: This Doji pattern has long upper and lower wicks, indicating significant volatility and indecision in the market. It suggests that buyers and sellers are evenly matched and that a trend reversal may occur.
Dragonfly Doji: The Dragonfly Doji has a long lower wick and no upper wick, resembling a dragonfly. It often appears at the bottom of a downtrend and suggests a potential bullish reversal.
Gravestone Doji: The Gravestone Doji has a long upper wick and no lower wick, resembling a gravestone. It often appears at the top of an uptrend and suggests a potential bearish reversal.
Hammer and Hanging Man:
The hammer and hanging man candlestick patterns have similar characteristics, but their interpretations differ based on their occurrence within the market trend.
- Hammer: The hammer pattern forms after a downtrend and signifies a potential bullish reversal. It has a small body near the top of the candle and a long lower wick, indicating that sellers pushed the price lower but were ultimately overcome by buyers.
- Hanging Man: The hanging man pattern appears after an uptrend and suggests a potential bearish reversal. It has a small body near the bottom of the candle and a long lower wick, indicating that buyers pushed the price higher but were unable to sustain the momentum.
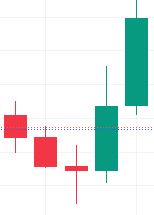
Engulfing Patterns:
Engulfing patterns occur when one candlestick’s body completely engulfs the body of the preceding candlestick. These patterns indicate a potential trend reversal.
- Bullish Engulfing Pattern: A bullish engulfing pattern forms when a small bearish candle is followed by a larger bullish candle. The bullish candle completely engulfs the previous bearish candle, suggesting a shift from bearish sentiment to bullish sentiment. Traders often interpret this pattern as a signal to enter long positions.
- Bearish Engulfing Pattern: A bearish engulfing pattern occurs when a small bullish candle is followed by a larger bearish candle. The bearish candle engulfs the previous bullish candle, indicating a transition from bullish sentiment to bearish sentiment. Traders often interpret this pattern as a signal to enter short positions.
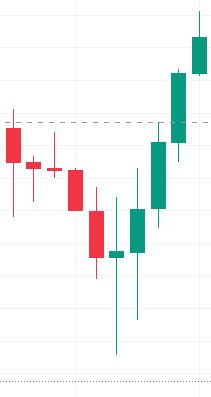
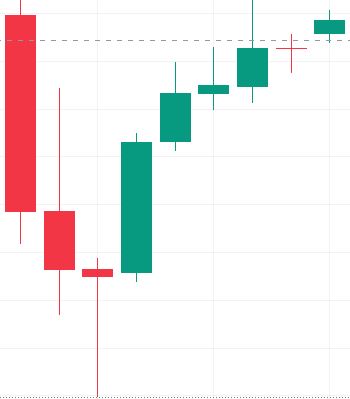
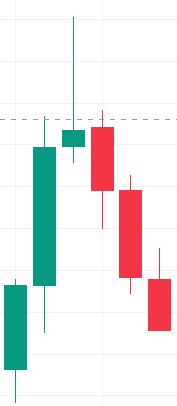
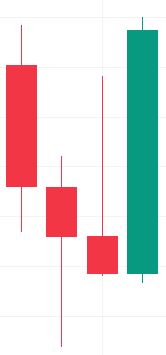
Morning Star and Evening Star:
The morning star and evening star patterns consist of a series of three candles and signal potential trend reversals.
- Morning Star: The morning star pattern occurs during a downtrend. It consists of a long bearish candle, followed by a small-bodied candle (Doji or spinning top) that signifies market indecision, and finally, a long bullish candle. The morning star pattern suggests a potential bullish reversal.
- Evening Star: The evening star pattern occurs during an uptrend. It begins with a long bullish candle, followed by a small-bodied candle that indicates indecision, and ends with a long bearish candle. The evening star pattern suggests a potential bearish reversal.
Shooting Star and Inverted Hammer:
Both the shooting star and inverted hammer patterns have a small body and a long upper wick, but their interpretations differ based on their occurrence within the market trend.
- Shooting Star: The shooting star pattern forms after an uptrend, indicating a potential bearish reversal. It has a small body near the bottom of the candle and a long upper wick, suggesting that sellers entered the market and pushed the price down, erasing the gains made by buyers.
- Inverted Hammer: The inverted hammer pattern appears after a downtrend and suggests a potential bullish reversal. It has a small body near the top of the candle and a long upper wick, indicating that buyers entered the market and pushed the price up, overpowering sellers.
Candlestick formations play a crucial role in trading as they provide traders with valuable information about market sentiment and price action. By understanding and recognizing various candlestick patterns, traders can gain a competitive edge and make informed decisions.
* The information provided here has been prepared by Eightcap’s team of analysts. All expressions of opinion are subject to change without notice. Any opinions made may be personal to the author and do not reflect the opinions of Eightcap.
In addition to the disclaimer on our website, the material on this page does not contain a record of our trading prices, or represent an offer or solicitation for a transaction in any financial instrument. Eightcap accepts no responsibility for any use that may be made of these comments and for any consequences that result. No representation or warranty is given as to the accuracy or completeness of this information. Consequently, any person acting on it does so entirely at their own risk. Any research provided does not have regard to the specific investment objectives, financial situation and needs of any specific person who may receive it. It has not been prepared in accordance with legal requirements designed to promote the independence of investment research and as such is considered to be a marketing communication.
Please note that past performance is not a guarantee or prediction of future performance. This communication must not be reproduced or further distributed without prior permission.