
Understanding the Donchian Channel indicator on Trading View: A Comprehensive Guide

The Donchian Channel, a powerful tool in a trader’s arsenal, offers insights into market trends, breakouts, and volatility. Developed by Richard Donchian, this indicator comprises three lines that dynamically encapsulate price action over a defined period.
Donchian Channels (DC) serve as a tool in technical analysis for assessing market volatility. They resemble the banded indicator concept of Bollinger Bands %B (%B). Beyond gauging volatility, Donchian Channels excel in spotting potential breakouts or detecting overbought/oversold scenarios when prices touch the Upper or Lower Band. These occurrences often signal potential trading opportunities.
Components of the Donchian Channel
Donchian Channels are one of the more straightforward indicators to calculate and understand. The indicator simply takes a user defined number of periods (20 Days for example) and calculates the Upper and Lower Bands. The Upper Band is the high price for the period. The Lower Band is the low price for the period. The Middle Line is simply the average of the two.
- Upper Band: Represents the highest high over a specified period.
- Lower Band: Indicates the lowest low over the same period.
- Middle Band: Often not displayed but represents the average price movement within the period.
Calculation
For this example, a 20 day period is used which is a very commonly used timeframe.
Upper Channel = 20 Day High
Lower Channel = 20 Day Low
Middle Channel = (20 Day High + 20 Day Low)/2
Practical Applications of the Donchian Channel
The main function of Donchian Channels is to measure volatility. When volatility is high, the bands will widen and when volatility is low, the bands become more narrow. When price reaches or breaks through one of the bands, this indicate an overbought or oversold condition. This can essentially result in one of two things. First, the current trend has been confirmed and the breakthrough will cause a significant move in price in the same direction. The second result is that the trend has already been confirmed and the breakthrough indicates a possible small reversal before continuing in the same direction.
1. Breakout Trading Strategies
The Donchian Channel is highly regarded for its ability to identify potential breakouts, both bullish and bearish.
Bullish Breakout Strategy:
- Identification: When the price breaches above the upper band of the Donchian Channel after a period of consolidation, it suggests potential upward momentum.
- Implementation: Traders might consider initiating long positions or buying assets to capitalize on the anticipated bullish trend continuation.
- Example Scenario: In the case of a stock, suppose its price breaks decisively above the upper band after trading in a tight range. This breakout might indicate increasing buyer momentum, prompting traders to enter long positions.
Bearish Breakout Strategy:
- Identification: A breach below the lower band implies potential downward momentum or a bearish breakout.
- Implementation: Traders might consider selling short or liquidating long positions to benefit from the expected downtrend.
- Example Scenario: For instance, in the context of a cryptocurrency, if its price consistently falls below the lower band after a period of sideways movement, it could signal a significant downward trend.
2. Volatility Measurement
Understanding volatility through the Donchian Channel assists traders in managing risk and setting appropriate entry and exit points.
Wide Channels and Increased Volatility:
- Analysis: A widening gap between the upper and lower bands signifies heightened market volatility.
- Strategy: Traders might adjust their risk exposure by widening stop-loss levels or reducing position sizes to account for potential erratic price movements.
- Example Scenario: During major economic announcements or geopolitical events, the Donchian Channel might exhibit increased width, indicating elevated volatility and the need for cautious trading.
Narrow Channels and Decreased Volatility:
- Analysis: When the Donchian Channel narrows, it signals reduced market volatility and potential consolidation.
- Strategy: Traders might anticipate an impending breakout or trend change, preparing to enter positions as the market prepares for a shift in direction.
- Example Scenario: In a stable market with limited price fluctuations, the Donchian Channel might contract, prompting traders to anticipate a forthcoming breakout or trend change.
3. Trend Identification
The Donchian Channel assists in identifying and confirming trends, aiding traders in aligning with prevailing market directions. Oftentimes, in a clearly defined trend, overbought or oversold conditions can be a significant sign of strength.
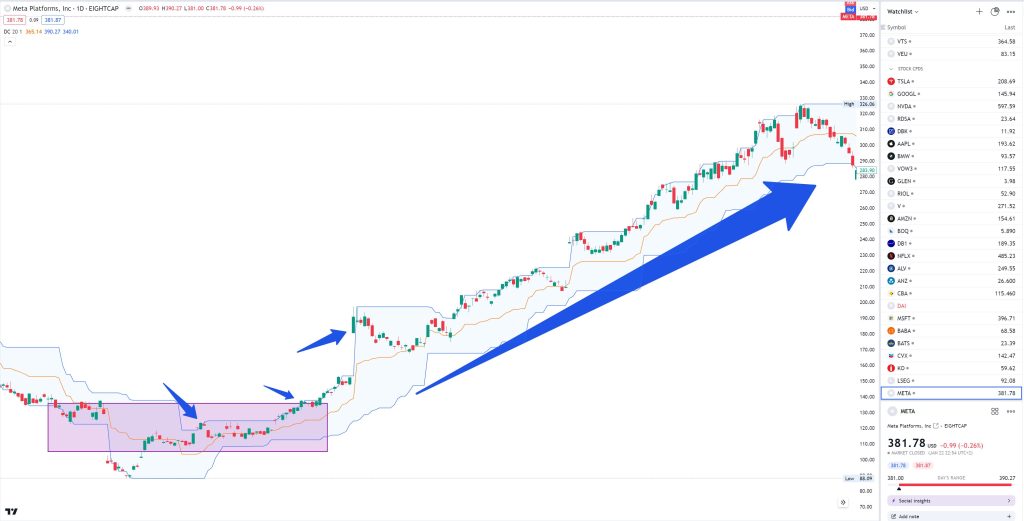
Bullish Trend Confirmation:
- Analysis: Prices consistently remaining above the middle line indicate a prevailing bullish trend.
- Strategy: Traders might consider buying during pullbacks to the middle line, aligning with the overall upward momentum.
- Example Scenario: If a stock consistently rides above the middle line and experiences pullbacks toward it before resuming its uptrend, it confirms a bullish sentiment.
Bearish Trend Confirmation:
- Analysis: Prices consistently staying below the middle line suggest a prevailing bearish trend.
- Strategy: Traders may seek short-selling opportunities during retracements to the middle line, aligning with the overall downward momentum.
- Example Scenario: In the case of a currency pair consistently trending below the middle line, it indicates a bearish market sentiment, and retracements toward the middle line might present short-selling opportunities.
Efficiency of the Donchian Channel Across Markets
The Donchian Channel can be effectively applied across various financial markets due to its versatility in identifying trends, breakouts, and volatility. Here’s a breakdown of its efficiency in different markets:
Stock CFDs:
Trend Identification:
- Efficiency: The Donchian Channel is adept at identifying trends in individual stocks or broader indices, helping traders gauge the direction of stock movements.
- Usage: It assists in confirming whether a stock is in an upward or downward trend by observing its position relative to the channel’s lines.
Breakout Confirmation:
- Efficiency: In stock markets, breakouts are pivotal moments, and the Donchian Channel excels in confirming these breakout points.
- Usage: It helps traders recognize when a stock is breaking out from its previous range or consolidation phase, indicating potential upward or downward movements.
Volatility Measurement:
- Efficiency: Volatility often impacts stock prices, and the Donchian Channel’s width helps traders gauge the magnitude of price movements.
- Usage: It aids in assessing the degree of price fluctuation in a stock, offering insights into potential risks and opportunities.
Example of Donchian Channel in Stock Markets:
Apple Inc. (AAPL):
Trend Identification:
- Suppose a trader is observing AAPL’s price action over several months. The Donchian Channel, set to a 50-day period, showcases the upper and lower bands around AAPL’s price.
- If AAPL consistently trades above the middle line of the Donchian Channel and the upper band, it suggests a sustained bullish trend.
Breakout Confirmation:
- Imagine AAPL has been trading within a range for a prolonged period. Suddenly, the price breaks decisively above the upper band of the Donchian Channel.
- This breakout signals a potential upward movement, prompting traders to consider initiating long positions or holding existing ones, anticipating further price appreciation.
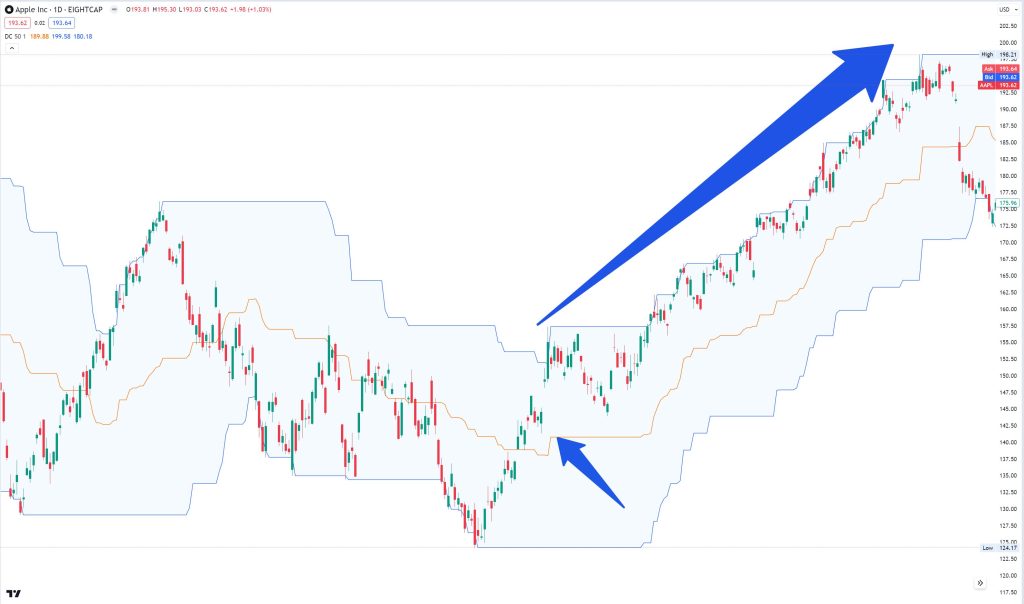
Volatility Measurement:
- During earnings season or major product announcements, AAPL’s price might exhibit increased volatility.
- The widening of the Donchian Channel around such events signifies heightened price fluctuations, allowing traders to adjust their risk management strategies accordingly.
Forex Markets:
Trend Identification:
- Efficiency: In Forex, the Donchian Channel aids in identifying and confirming trends in currency pairs.
- Usage: It assists traders in recognizing whether a currency pair is experiencing an uptrend or downtrend by assessing its position in relation to the channel’s lines.
Breakout Confirmation:
- Efficiency: Traders rely on the Donchian Channel to confirm breakouts in Forex pairs, which can indicate potential shifts in currency values.
- Usage: It helps identify when a currency pair breaks out of a range, signaling potential opportunities for traders to enter or exit positions.
Volatility Measurement:
- Efficiency: Volatility is inherent in the Forex market, and the Donchian Channel’s width is instrumental in measuring the magnitude of price movements.
- Usage: Traders leverage the channel’s width to gauge volatility, assisting in risk assessment and position sizing.
Example of Donchian Channel in Forex Markets:
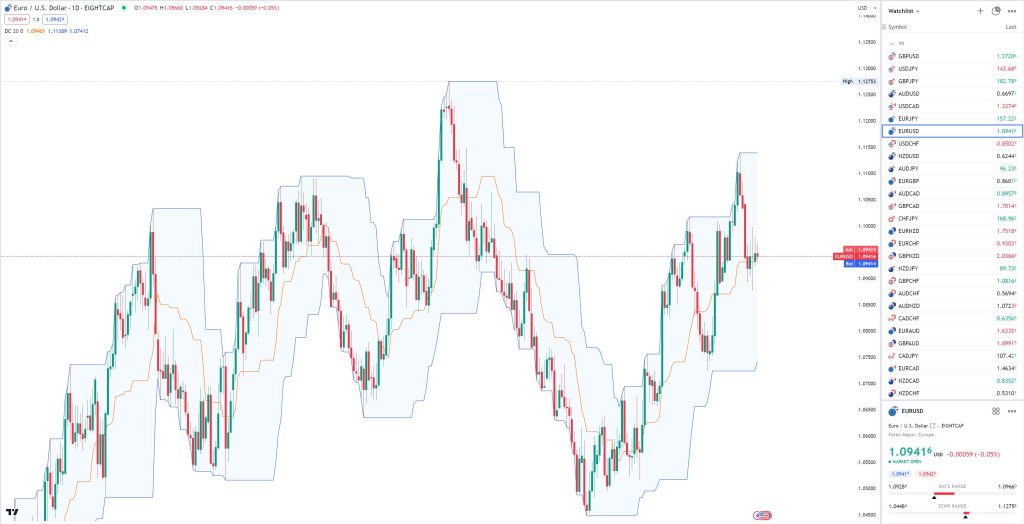
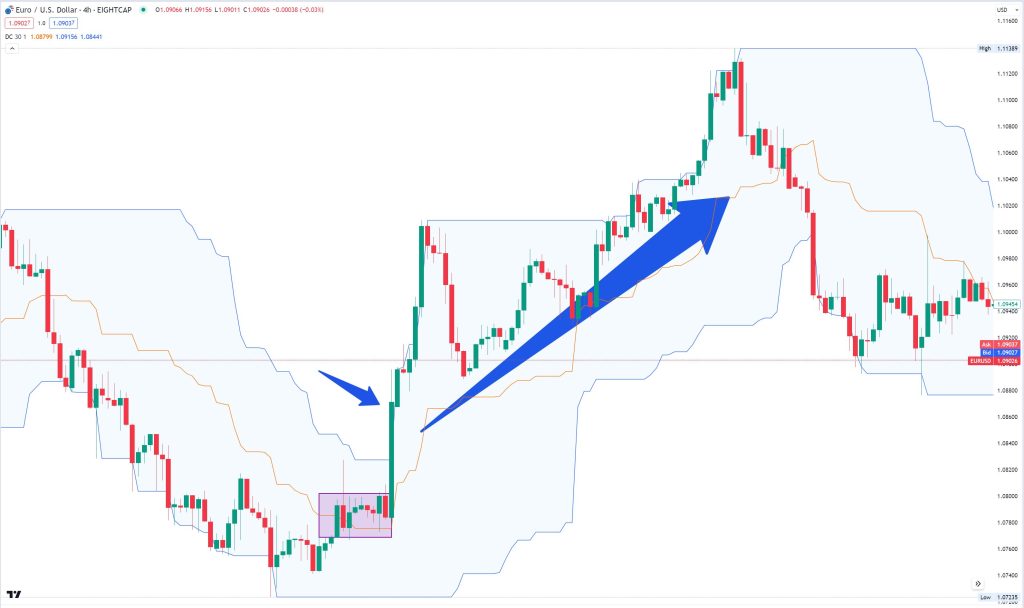
EUR/USD Currency Pair:
Trend Identification:
- Consider a trader analyzing the EUR/USD pair over a specified period, using a 30-day Donchian Channel.
- If the EUR/USD consistently trades above the middle line and upper band, it suggests a sustained bullish trend in the Euro against the US Dollar.
Breakout Confirmation:
- Suppose the EUR/USD has been ranging within a tight price band for a while. Suddenly, the price breaks decisively above the upper band of the Donchian Channel.
- This breakout indicates a potential upward movement in the Euro’s value relative to the Dollar, prompting traders to consider long positions.
Volatility Measurement:
- During major economic events such as central bank announcements or geopolitical shifts impacting the Eurozone, the EUR/USD might experience increased volatility.
- Traders observing the widening of the Donchian Channel around such events can infer heightened price fluctuations, leading them to adjust their risk management strategies accordingly.
Commodities:
Trend Identification:
- Efficiency: The Donchian Channel assists in identifying trends within various commodities, aiding traders in recognizing prolonged upward or downward movements.
- Usage: Traders utilize the channel to confirm whether a commodity is in an ongoing bullish or bearish trend by observing its position relative to the channel’s lines.
Breakout Confirmation:
- Efficiency: Breakouts are crucial moments in commodities trading, and the Donchian Channel helps confirm these pivotal points.
- Usage: It assists traders in identifying when a commodity breaks out of its previous price range or consolidating phase, indicating potential opportunities for significant price movements.
Volatility Measurement:
- Efficiency: Commodities often experience volatile price swings, and the Donchian Channel’s width aids in measuring the intensity of these fluctuations.
- Usage: Traders leverage the channel’s width to assess the degree of volatility in commodities, guiding risk management strategies and position sizing.
Example of Donchian Channel in Commodities:
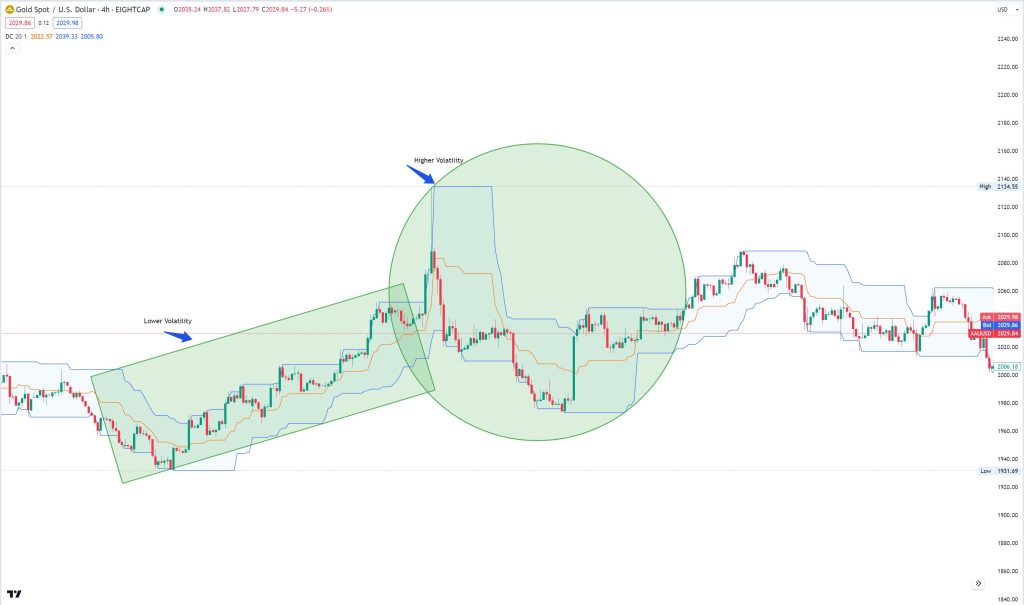
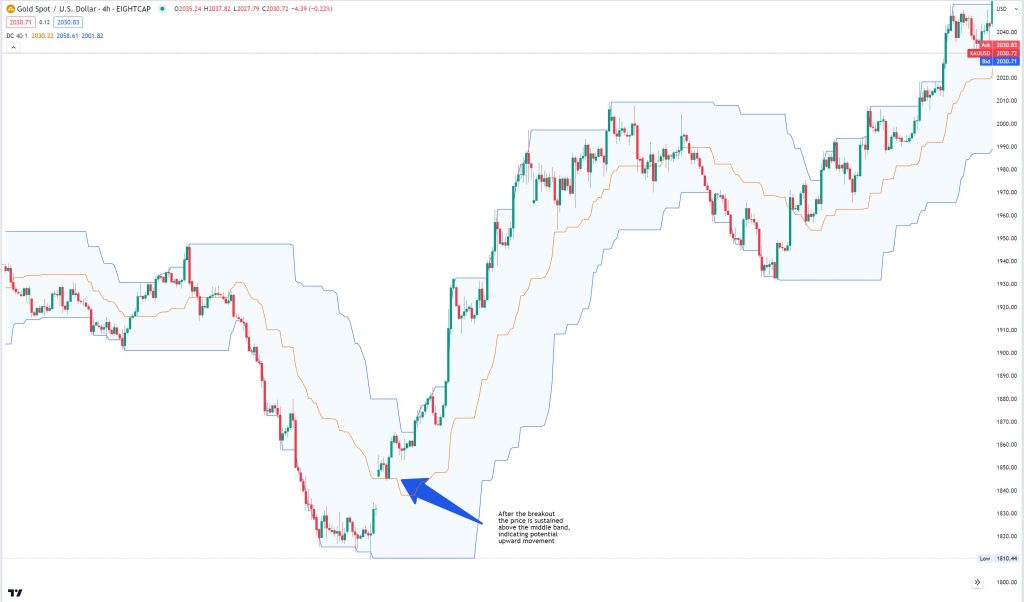
Gold (XAU/USD):
Trend Identification:
- Consider a trader observing the price of gold using a Donchian Channel set to a 40-day period.
- If gold consistently trades above the middle line and upper band of the Donchian Channel, it suggests a sustained bullish trend in the price of gold.
Breakout Confirmation:
- Suppose gold has been consolidating within a narrow range for an extended period. Suddenly, the price breaks decisively above the upper band of the Donchian Channel.
- This breakout may indicate a potential upward movement in the price of gold, signaling to traders the possibility of initiating long positions or holding existing ones.
Volatility Measurement:
- During economic uncertainty or geopolitical tensions affecting global markets, gold prices might exhibit increased volatility.
- Traders monitoring the widening of the Donchian Channel around such events can infer heightened price fluctuations in gold, prompting adjustments in risk management strategies.
Cryptocurrency Markets
Trend Identification:
- Efficiency: In the volatile cryptocurrency market, the Donchian Channel aids in identifying and confirming trends in various digital assets.
- Usage: It assists traders in recognizing whether a cryptocurrency is experiencing an uptrend or downtrend by observing its position in relation to the channel’s lines.
Breakout Confirmation:
- Efficiency: Traders rely on the Donchian Channel to confirm breakouts in cryptocurrencies, which often signify significant shifts in their values.
- Usage: It helps in identifying when a cryptocurrency breaks out of a consolidation phase, indicating potential opportunities for traders to initiate positions.
Volatility Measurement:
- Efficiency: Cryptocurrency markets are known for their high volatility, and the Donchian Channel’s width aids in measuring the magnitude of price movements.
- Usage: Traders leverage the channel’s width to gauge volatility, enabling them to adjust their strategies and manage risks effectively in the ever-changing crypto space.
Example of Donchian Channel in Cryptocurrency Markets:
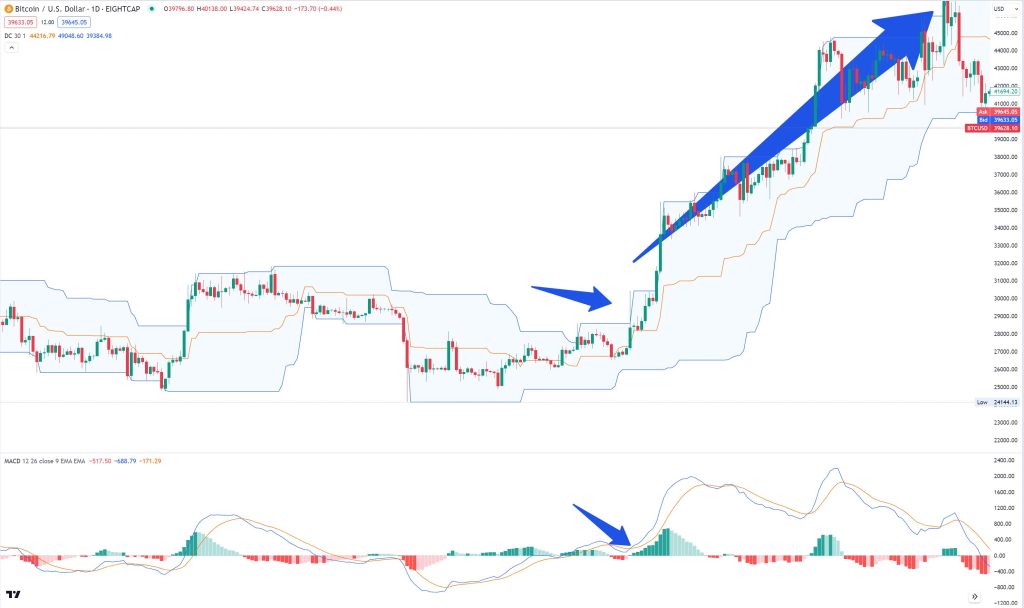
Bitcoin (BTC/USD):
Trend Identification:
- Consider a trader analyzing the price of Bitcoin using a Donchian Channel set to a 30-day period.
- If Bitcoin consistently trades above the middle line and upper band of the Donchian Channel, it suggests a sustained bullish trend in the price of Bitcoin.
Breakout Confirmation:
- Suppose Bitcoin has been trading within a narrow range for an extended period. Suddenly, the price breaks decisively above the upper band of the Donchian Channel.
- This breakout may indicate a potential upward movement in the price of Bitcoin, signaling to traders the possibility of initiating long positions or holding existing ones.
Volatility Measurement:
- During significant market events like regulatory announcements or major technological developments affecting cryptocurrencies, Bitcoin’s price might exhibit increased volatility.
- Traders monitoring the widening of the Donchian Channel around such events can infer heightened price fluctuations in Bitcoin, prompting adjustments in risk management strategies.
Indices and ETFs
Trend Identification:
- Efficiency: The Donchian Channel aids in identifying trends in indices and ETFs, offering a glimpse into the overall market or specific sectors.
- Usage: It assists traders in recognizing whether an index or ETF is in an uptrend or downtrend by observing its positioning relative to the channel’s lines.
Breakout Confirmation:
- Efficiency: Traders rely on the Donchian Channel to confirm breakouts in indices or ETFs, indicating potential shifts in market sentiment or sectoral movements.
- Usage: It helps in identifying when an index or ETF breaks out of a consolidation phase, signaling potential opportunities for traders to take positions.
Volatility Measurement:
- Efficiency: Volatility impacts indices and ETFs, and the Donchian Channel’s width aids in measuring the magnitude of price movements in these diversified instruments.
- Usage: Traders leverage the channel’s width to gauge volatility, enabling them to adjust their strategies and manage risks concerning broader market movements or specific sectors.
Example of Donchian Channel in Indices and ETFs:
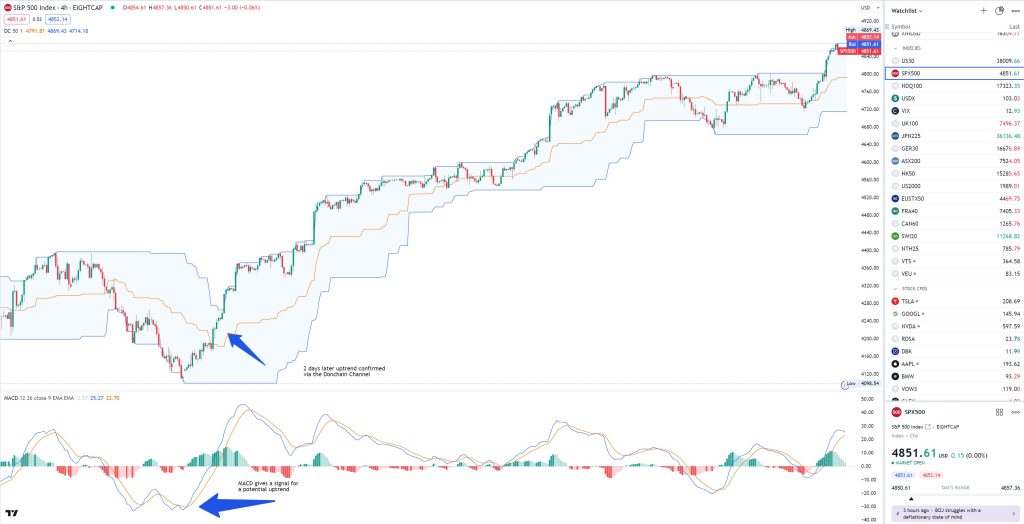
S&P 500 Index (SPX):
Trend Identification:
- Consider a trader analyzing the S&P 500 Index using a Donchian Channel set to a 50-day period.
- If the S&P 500 consistently trades above the middle line and upper band of the Donchian Channel, it suggests a sustained bullish trend in the broader market.
Breakout Confirmation:
- Suppose the S&P 500 has been moving sideways within a range for some time. Suddenly, the index breaks decisively above the upper band of the Donchian Channel.
- This breakout may indicate a potential upward movement in the market, prompting traders to consider positions aligned with the market’s sentiment.
Volatility Measurement:
- During periods of economic uncertainty, geopolitical tensions, or corporate earnings seasons, the S&P 500 might exhibit increased volatility.
- Traders observing the widening of the Donchian Channel around such events can infer heightened price fluctuations in the market, guiding adjustments in risk management strategies
Time frame platform charts vs. efficiency
The effectiveness of the Donchian Channel can vary based on the timeframe used in chart analysis. The choice of timeframe largely depends on a trader’s trading style, preferences, and the market being analyzed. However, here’s a breakdown of different timeframes and their relevance to the Donchian Channel:
Shorter Timeframes (Intraday Trading)
- Usage: Shorter timeframes like 5-minute, 15-minute, or 1-hour charts are suitable for intraday traders.
- Application: The Donchian Channel on shorter timeframes helps identify intraday trends, breakout opportunities, and short-term volatility, aiding quick trading decisions.
Medium Timeframes (Swing Trading)
- Usage: Timeframes between 4-hour, daily, and weekly charts suit swing traders.
- Application: The Donchian Channel on these timeframes assists in identifying medium-term trends, confirming breakouts, and gauging overall market sentiment for swing trading positions.
Longer Timeframes (Positional or Long-Term Trading)
- Usage: Daily, weekly, and monthly charts cater to positional or long-term traders.
- Application: On longer timeframes, the Donchian Channel helps in identifying broader market trends, confirming major breakouts, and providing a comprehensive view for making long-term trading decisions.
Accuracy and Considerations
- Higher Timeframes: Longer timeframes often provide more reliable and stable signals as they filter out short-term noise, but they might have fewer trading opportunities.
- Shorter Timeframes: Shorter timeframes offer more frequent signals but may also present more false or erratic signals due to market noise.
Choosing the Right Timeframe
- Trading Style: Align the timeframe with your trading style and preferred holding period. Intraday traders may favor shorter timeframes, while long-term investors may opt for longer ones.
- Experimentation: Experiment with different timeframes to determine which aligns best with the asset being traded and your trading strategy.
Practical Use on TradingView
On TradingView, incorporating the Donchian Channel involves:
Adding the Indicator: Locate and add the Donchian Channel indicator to your chart from the Indicators list on top of the platform.
Customization:
- Length: Adjust the period length (e.g., 20 periods) based on your trading style and preferences.
- Offset: Changing this number will move the Donchian Channels either Forwards or Backwards relative to the current market. 0 is the default.
- Timeframe: Specifies the timeframe that the indicator is calculated on. This option allows calculating VWAP based on a data from another timeframe, e.g. having VWAP calculated on 1H chart be displayed on a 5m chart.
- Wait for timeframe closes: Specifies the behavior when the indicator’s timeframe is higher than the chart’s. When ‘Wait for timeframe closes’ is checked, higher timeframe values only come in and are interconnected on the chart when the higher timeframe completes.
The Donchian Channel stands as a versatile and powerful tool in the realm of technical analysis, offering insights into market trends, breakouts, and volatility. Its applicability spans across diverse financial markets, including stocks, forex, commodities, cryptocurrencies, indices, and ETFs. By identifying trends, confirming breakouts, and measuring volatility, the Donchian Channel assists traders in making informed decisions.
However, its effectiveness isn’t standalone. When combined with other indicators such as Moving Averages, RSI, Volume Profile, or MACD, the Donchian Channel’s capabilities are amplified. This integration offers a more comprehensive view of market dynamics, confirming signals and validating trading strategies across different timeframes and market conditions.
* The information provided here has been prepared by Eightcap’s team of analysts. All expressions of opinion are subject to change without notice. Any opinions made may be personal to the author and do not reflect the opinions of Eightcap.
In addition to the disclaimer on our website, the material on this page does not contain a record of our trading prices, or represent an offer or solicitation for a transaction in any financial instrument. Eightcap accepts no responsibility for any use that may be made of these comments and for any consequences that result. No representation or warranty is given as to the accuracy or completeness of this information. Consequently, any person acting on it does so entirely at their own risk. Any research provided does not have regard to the specific investment objectives, financial situation and needs of any specific person who may receive it. It has not been prepared in accordance with legal requirements designed to promote the independence of investment research and as such is considered to be a marketing communication.
Please note that past performance is not a guarantee or prediction of future performance. This communication must not be reproduced or further distributed without prior permission.