
Parabolic SAR Indicator

It is a trend-following indicator that is designed to help traders determine the direction of the market trend and to provide signals for entry and exit points.
How the Parabolic SAR Works?
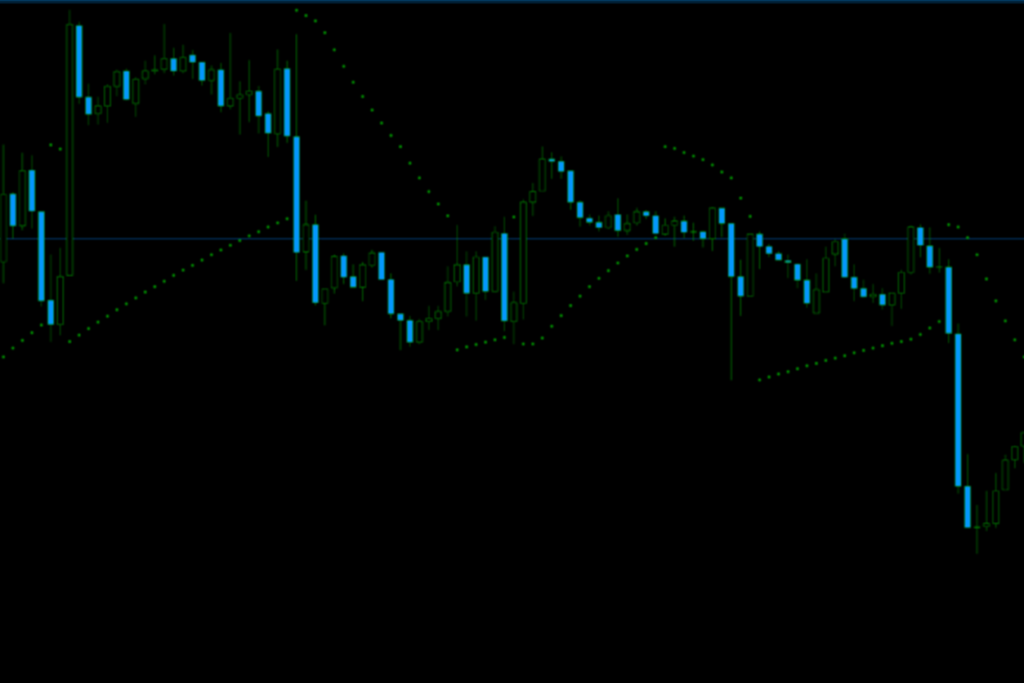
The Par SAR is plotted as a series of dots on a chart. The dots are positioned above or below the price bars depending on the direction of the trend. If the dots are above the price bars, it indicates a downtrend, and if the dots are below the price bars, it indicates an uptrend.
The Parabolic SAR is calculated using the following formula:
Where:
- SARn is the SAR value for the previous period
- AF (acceleration factor) starts at 0.02 and increases by 0.02 each time a new high is reached in an uptrend or a new low is reached in a downtrend, up to a maximum of 0.20
- EP (extreme point) is the highest high in an uptrend or the lowest low in a downtrend.
The formula is designed to accelerate the SAR’s movement as the trend continues, which allows traders to catch a significant portion of the trend while minimizing losses during retracements.
How to Use the Parabolic SAR for Forex Trading
The Parabolic SAR is a versatile indicator that can be used in several ways to improve trading decisions. Here are some tips on how to use the Parabolic SAR for forex trading:
Identifying the Trend
This is an excellent tool for identifying the market trend. If the dots are below the price bars, it indicates an uptrend, and if the dots are above the price bars, it indicates a downtrend.
Entry and Exit Points
It can provide valuable signals for entry and exit points. When the dots flip from below to above the price bars, it indicates a potential trend reversal from an uptrend to a downtrend, and traders may want to consider selling.
Stop Loss
The Parabolic SAR can be used as a trailing stop-loss tool. When a position is opened, traders can set the stop loss at the SAR level for the previous period. As the trend continues, the SAR level will move closer to the price bars, providing a tighter stop loss and minimizing potential losses.
Confirmation with Other Indicators
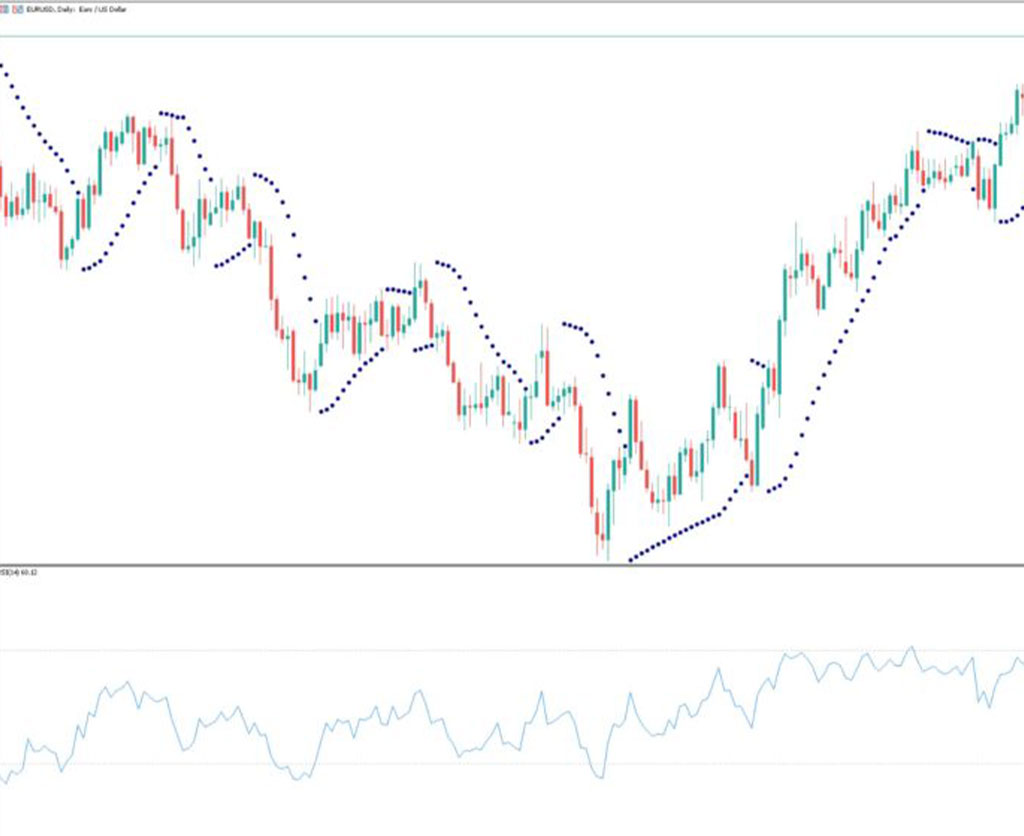
While the Par SAR is a powerful tool, it is always best to confirm signals with other technical analysis indicators, such as moving averages or the Relative Strength Index (RSI). By combining multiple indicators, traders can increase their confidence in trading decisions.

Here is a hypothetical example to illustrate how the Parabolic SAR can be used for forex trading.
Let’s say that you are analyzing the EUR/USD currency pair and you have decided to use the Parabolic SAR to identify the trend and entry and exit points. You have plotted the indicator on a daily chart, and the dots are currently below the price bars, indicating an uptrend.
You decide to enter a long position (buy) when the price reaches a new high and the Parabolic SAR dots are still below the price bars. You place a stop loss at the SAR level for the previous period, which is currently below the price bars.
If the price continues to move in your favor, you can adjust the stop loss accordingly.
How to customize Parabolic SAR to avoid lagging.
Like most indicators, the Par SAR can be subject to lag, which can delay its signals and reduce its effectiveness. Below we will discuss how to customize it to avoid lagging.
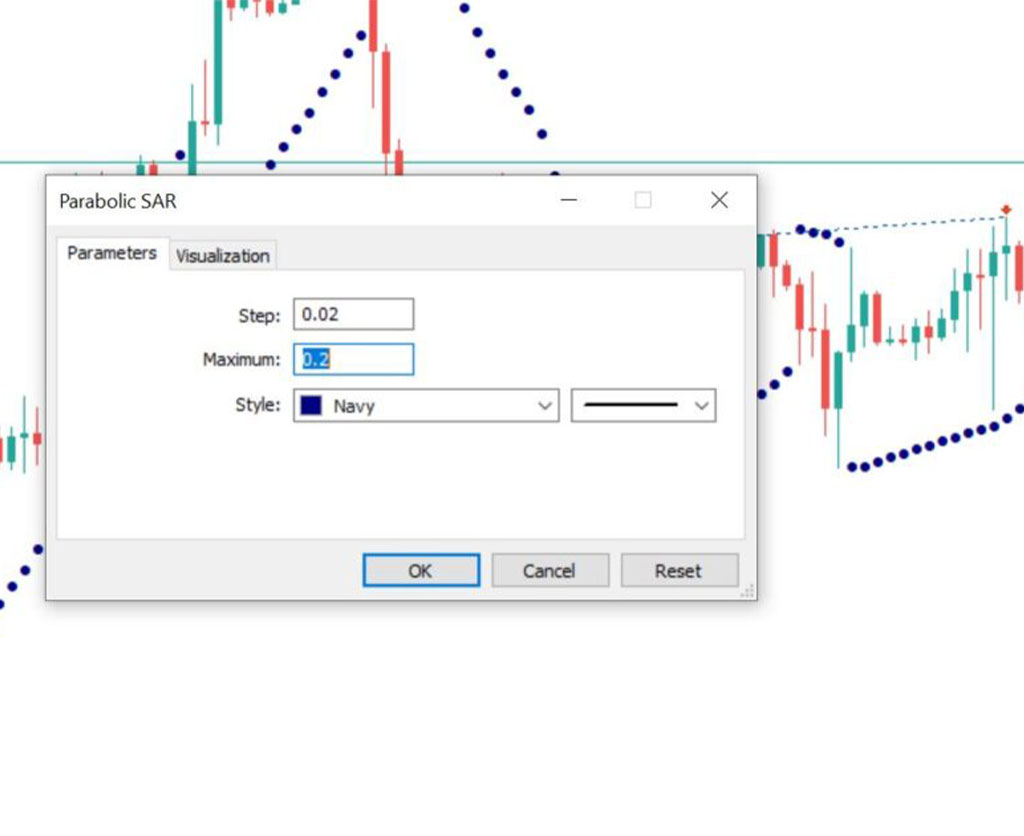
Adjust the acceleration factor:
The acceleration factor is a parameter in the Parabolic SAR formula that determines the rate at which the indicator moves closer to the price.
However, you can adjust the acceleration factor to increase or decrease the sensitivity of the indicator. A higher acceleration factor will make the Parabolic SAR move closer to the price faster, while a lower acceleration factor will make it move slower. You can experiment with different acceleration factor values to find the optimal setting for the asset you are trading.

Change the minimum AF value:
In addition to adjusting the acceleration factor, you can also change the minimum AF value. This parameter sets the lowest possible value that the acceleration factor can reach. By default, the minimum AF value is set to 0.02, which means that the acceleration factor will never go below this value. However, you can increase the minimum AF value to make the Parabolic SAR less sensitive to small price fluctuations, which can help reduce lag.
Use a longer time frame:
Another way to reduce lag is to use a longer time frame. The Parabolic SAR is calculated based on the price data from the previous period, so using a longer time frame can help smooth out the indicator and reduce the impact of small price fluctuations.
Combine with other indicators:
Finally, you can combine the Parabolic SAR with other indicators to confirm its signals and reduce lag. For example, you can use this indicator in conjunction with a moving average or a trendline to identify trend reversals more accurately.