
The Most Common Custom Trend Reversal Indicators on TradingView

TradingView, a platform highly regarded among traders and investors, offers not only a wide array of built-in technical indicators but also the flexibility to create custom indicators.
Recognizing trend reversals is pivotal for market participants, and having access to custom indicators tailored to this purpose can be a significant advantage. In this article, we’ll delve into some of the most prevalent custom trend reversal indicators available on the TradingView platform.
Introduction to Trend Reversal Indicators
Trend reversal indicators are technical tools designed to identify potential changes in the prevailing market direction. These indicators help traders anticipate shifts from bullish to bearish trends or vice versa, enabling them to enter or exit positions at opportune moments. Custom trend reversal indicators take the concept a step further by offering unique algorithms and customizable parameters that cater to traders’ specific preferences and strategies.
RSI Divergence
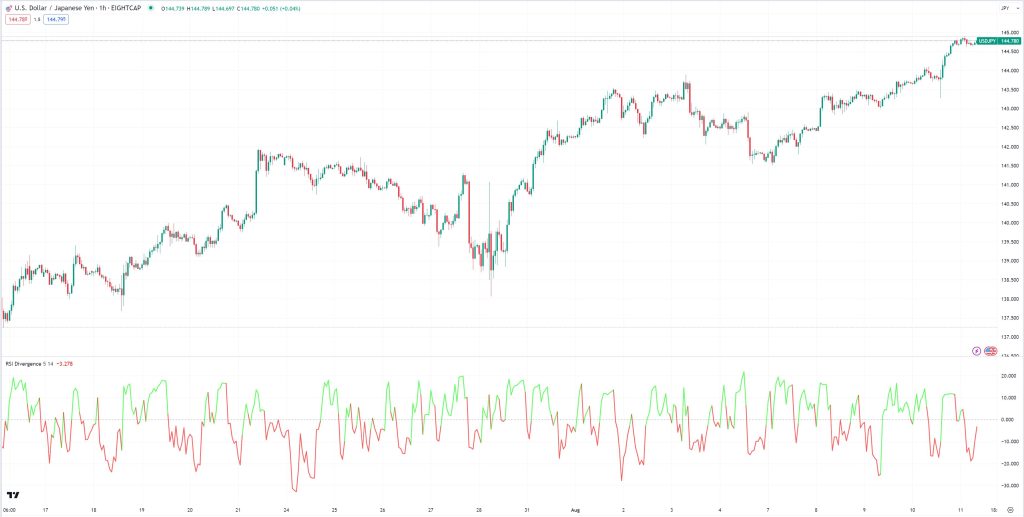
The Relative Strength Index (RSI) is a widely used momentum oscillator. RSI divergence occurs when the price and the RSI indicator move in opposite directions. This indicates a potential reversal in the current trend. RSI divergence can be effective in various markets, including stocks and forex.
The RSI formula involves calculating the ratio of average gains to average losses over a specified period of time. The result is then plotted on a scale from 0 to 100. Values above 70 are generally considered overbought, indicating a potential reversal to the downside, while values below 30 are considered oversold, suggesting a potential reversal to the upside.
Time Frame Charts: Even though the RSI Divergence is commonly used on lower time frame charts like 15 minutes or 1 hour as it helps traders spot short-term reversals, divergence analysis can be more reliable on higher timeframes. Signals on daily or weekly charts tend to carry more weight than those on shorter intraday timeframes. This is because higher timeframes filter out noise and provide a clearer view of the overall market direction.
RSI Divergence takes the concept of the traditional RSI a step further by analyzing the relationship between the RSI and the price movement of an asset. Divergence occurs when the direction of the price movement and the direction of the RSI diverge from each other. This discrepancy can signal a potential reversal or continuation of the current trend.
Identifying Divergence Patterns:
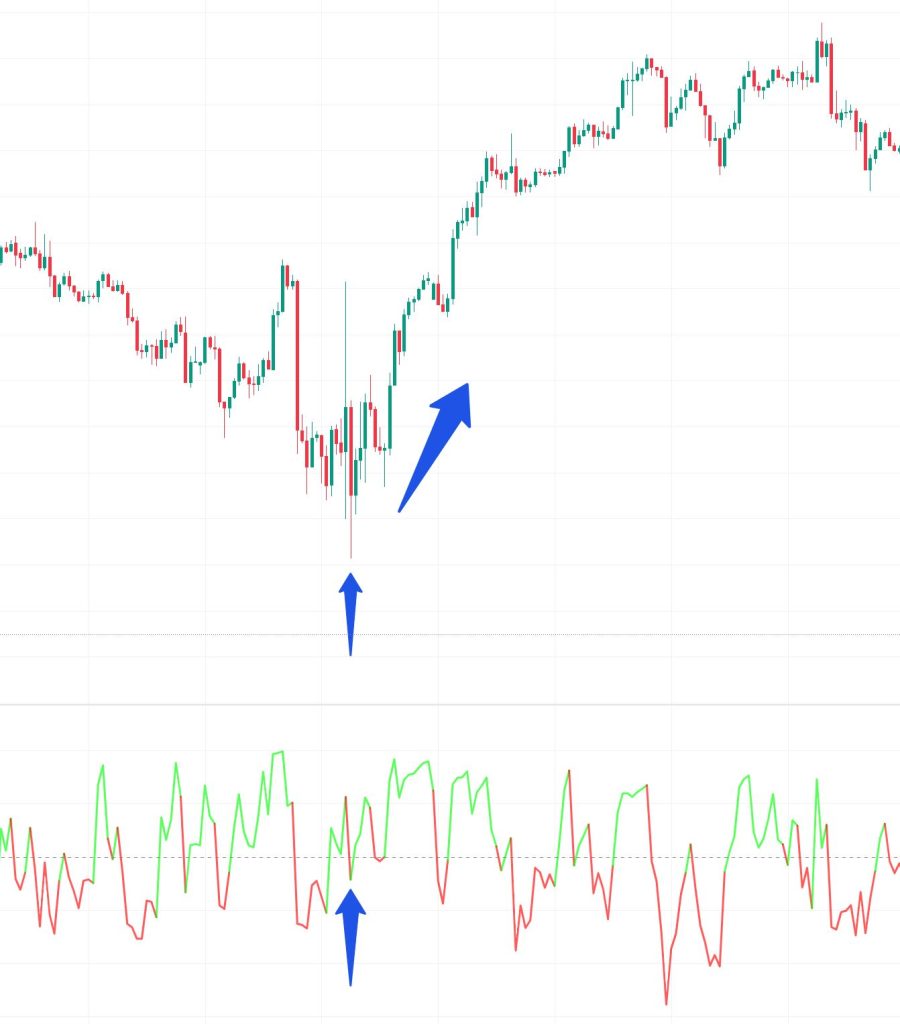
When you add the RSI Divergence indicator to your TradingView chart, it will plot markers on the chart that correspond to potential divergence patterns. Regular bullish and bearish divergences are the primary patterns you’ll be looking for.
Regular Bullish Divergence: Look for instances where the price of the asset forms a lower low, but the RSI indicator simultaneously forms a higher low. This scenario suggests that even though the price is showing weakness, the momentum behind the selling pressure is diminishing. Traders interpret this as a potential signal for an upcoming bullish reversal.
Regular Bearish Divergence: In contrast, regular bearish divergence occurs when the price of the asset forms a higher high, but the RSI indicator forms a lower high. This situation indicates that despite the price reaching new highs, the momentum of the buying pressure is weakening. This can be seen as a potential indication of a bearish reversal.
Understanding the Significance:
Interpreting divergence goes beyond simply identifying patterns. The significance of a divergence pattern depends on various factors, including the strength of the trend, the timeframe being analyzed, and the broader market context.
Trend Strength: Divergence signals are more potent when they occur after a prolonged and well-defined trend. A strong trend followed by a divergence pattern can suggest that the trend might be losing momentum and could be ripe for a reversal.
Confirming with Other Indicators:
While the RSI Divergence indicator can provide valuable insights, it’s advisable to use it in conjunction with other technical tools and indicators. This confirmation process can strengthen your analysis and enhance the reliability of your trading decisions.
- Support and Resistance: Consider overlaying trendlines, support and resistance levels, or chart patterns to validate the potential reversal indicated by the divergence pattern.
- Additional Oscillators: Combine RSI Divergence signals with other oscillators like the Moving Average Convergence Divergence (MACD) or the Stochastic Oscillator for further confirmation. When multiple indicators align, the likelihood of a successful trade setup increases.
- Volume Analysis: Volume can play a crucial role in confirming the validity of a trend reversal. An increase in volume during or after a divergence signal can enhance the reliability of the signal.
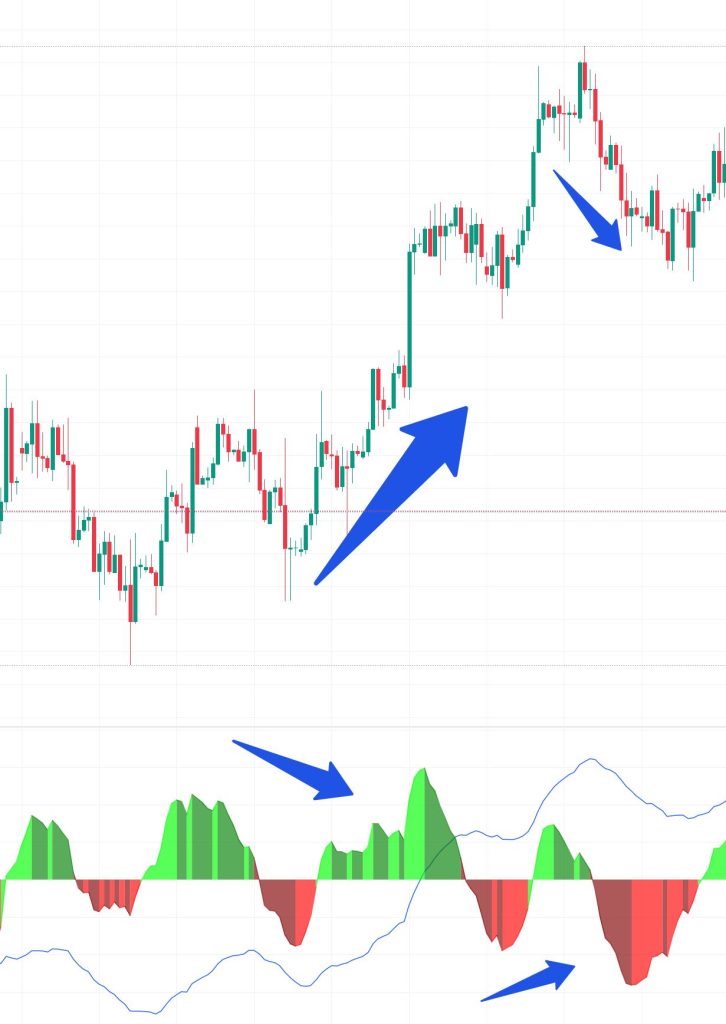
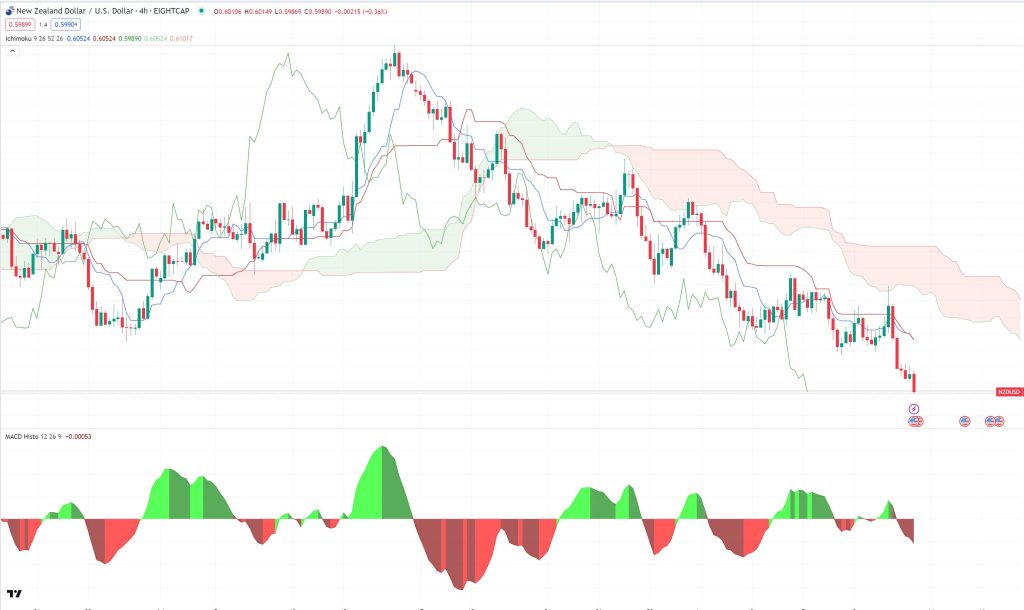
MACD Histogram

The Moving Average Convergence Divergence (MACD) Histogram is a modified version of the traditional MACD indicator. It focuses on the difference between the MACD line and the signal line, offering insights into trend momentum and potential reversals. The MACD Histogram is versatile and applicable to various markets and asset types, including commodities and indices.
Time Frame Charts: The MACD Histogram is suitable for both lower and higher time frame charts. Short-term traders can benefit from its signals on lower time frames, while longer-term traders can use it on daily or weekly charts.
Interpreting the MACD Histogram:
Histogram Width: The width of the histogram bars indicates the strength of the momentum. Wider bars suggest strong momentum shifts, while narrower bars signify weaker momentum.
Crossovers: Crossovers between the MACD line and the signal line often precede changes in trend direction. Bullish crossovers occur when the MACD line crosses above the signal line, while bearish crossovers occur when it crosses below.
Divergences: Divergences between the MACD Histogram and price action can signal potential trend reversals. A bullish divergence occurs when the price makes lower lows while the histogram makes higher lows. Conversely, a bearish divergence occurs when the price makes higher highs while the histogram makes lower highs.
Strategies for Trading with the MACD Histogram
Histogram Expansion: Traders often look for histogram bars that are expanding in height, indicating a strengthening trend. This could be an entry signal for a trending market.
Zero Line Crossings: Crossing above the zero line from below indicates a potential shift from bearish to bullish momentum, while crossing below the zero line from above suggests a shift from bullish to bearish momentum.
Histogram Contraction: As the histogram bars narrow, it signifies a decrease in momentum and potential consolidation. Traders might consider staying on the sidelines during these periods.
Customization: Experiment with different parameters for the MACD, such as changing the shorter and longer moving average periods. Adjust the signal line period as well for more responsive or smoother signals.
Enhancing MACD Histogram Analysis with Additional Indicators on TradingView
While the MACD Histogram on its own can provide valuable insights into market trends and momentum, combining it with other complementary indicators can enhance your trading analysis and decision-making. Here are a few additional indicators that can work efficiently alongside the MACD Histogram on TradingView:
Moving Average Crossovers: Combining the MACD Histogram with different moving average crossovers, such as the 50-period and 200-period Moving Averages, can help traders identify longer-term trends. A bullish MACD Histogram crossover accompanied by the 50-period Moving Average crossing above the 200-period Moving Average could signal a strong bullish trend.

Fibonacci Retracement Levels: Fibonacci retracement levels help identify potential support and resistance levels based on key price levels. Combining these levels with MACD Histogram signals can assist traders in identifying potential entry and exit points, especially when these levels align with areas of strong momentum shifts.
Stochastic Oscillator: The Stochastic Oscillator is another momentum indicator that can complement the MACD Histogram. It measures the relationship between the closing price and the trading range over a specified period. When the Stochastic Oscillator indicates overbought or oversold conditions in alignment with a MACD Histogram signal, it strengthens the case for potential trend reversals.
Ichimoku Cloud: The Ichimoku Cloud provides a comprehensive view of support, resistance, and trend direction. Combining the MACD Histogram with Ichimoku Cloud analysis can help traders make more informed decisions about potential entry and exit points, as well as the overall trend environment.
Applying the MACD Histogram on TradingView:
Accessing the Indicator: On the TradingView platform, adding the MACD Histogram is simple. Locate the “Indicators” button, search for “MACD Histogram,” and apply it to your chart.
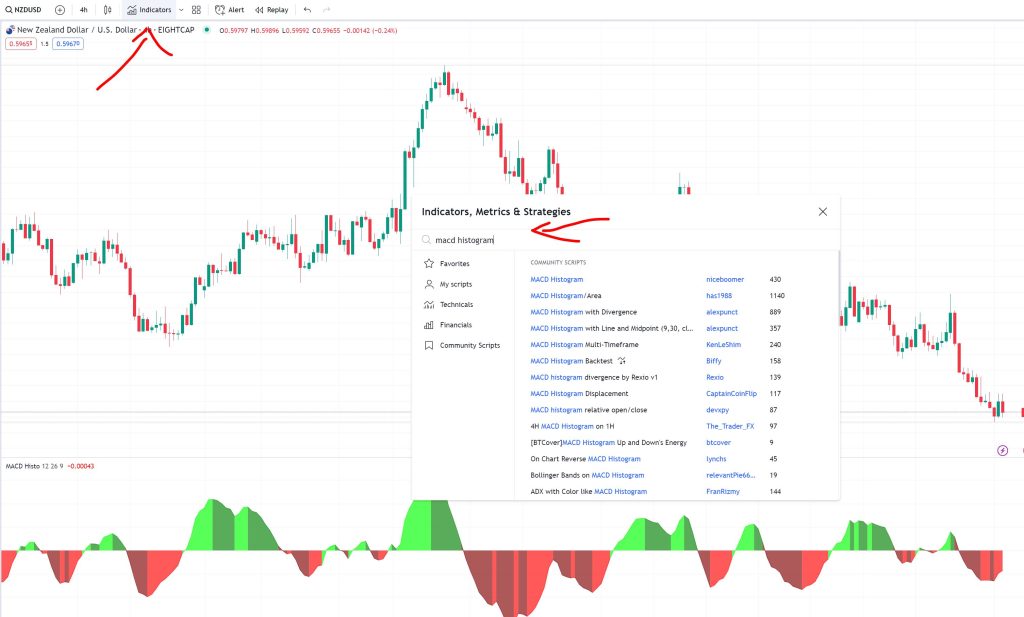
Customization: Traders can customize the indicator’s settings, such as altering the periods for the MACD and signal lines or adjusting the color scheme for better visualization.
Customizing trend reversal indicators can significantly enhance their efficiency and accuracy in identifying potential market shifts. Traders should remember that customization requires a balance between sensitivity and reliability. Over-optimization can lead to curve-fitting and false signals. Regularly testing and tweaking custom parameters through backtesting and historical analysis can help find the right settings for different markets and time frames.
* The information provided here has been prepared by Eightcap’s team of analysts. All expressions of opinion are subject to change without notice. Any opinions made may be personal to the author and do not reflect the opinions of Eightcap.
In addition to the disclaimer on our website, the material on this page does not contain a record of our trading prices, or represent an offer or solicitation for a transaction in any financial instrument. Eightcap accepts no responsibility for any use that may be made of these comments and for any consequences that result. No representation or warranty is given as to the accuracy or completeness of this information. Consequently, any person acting on it does so entirely at their own risk. Any research provided does not have regard to the specific investment objectives, financial situation and needs of any specific person who may receive it. It has not been prepared in accordance with legal requirements designed to promote the independence of investment research and as such is considered to be a marketing communication.
Please note that past performance is not a guarantee or prediction of future performance. This communication must not be reproduced or further distributed without prior permission.