
An i ntroduction to Elliot Wave Theory

About Elliott Wave Theory
Elliott Wave Theory consists of a set of principles which govern the way price trends develop over time. It is one of the most popular methods used to analyse markets and in particular equity and currency markets. The theory was developed by Ralph Nelson Elliott in the 1930s but remains as relevant as ever today.
The result is that price patterns tend to repeat over time and across different time frames.
By learning some of the principles of Elliott Wave theory, traders can use a process of elimination to identify likely scenarios. Trading strategies can be formulated around high probability scenarios with logical profit objectives and points of invalidation.
Basic Elliott Wave Principles
The following rules are almost never broken, and form the backbone of Elliott Wave analysis:
- Wave 2 cannot retrace more than 100% of wave 1
- Third wave cannot be the shortest of the three impulse waves
- Wave 4 cannot overlap wave 1
These rules are used to identify impulse waves, from which the likely wave count on a higher timeframe can be identified.
Impulse Waves
Elliott observed that regardless of the time frame being observed, trends tended to be made up of five waves. Three impulse waves move in the direction of the trend and two corrective waves that move counter to the trend. Each of these waves can be broken down further into smaller waves.
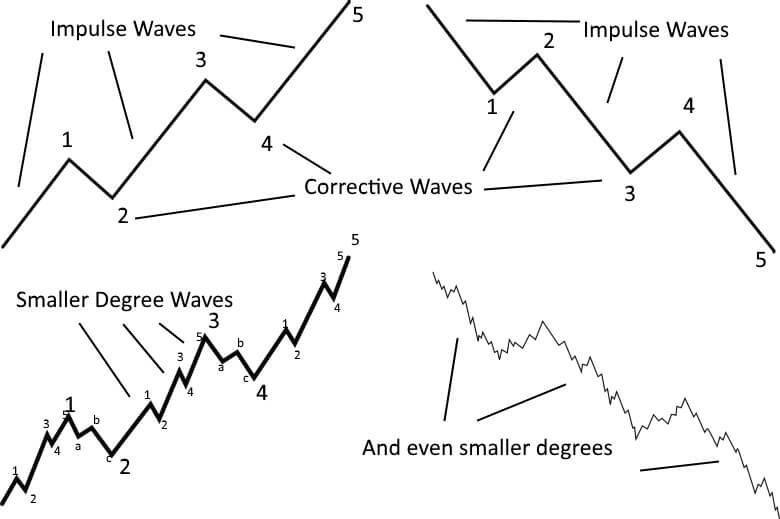
Five waves structures that last for decades can be continually subdivided into smaller waves to the point where trends last just a few minutes. Regardless of the degree of subdivision, these waves tend to follow the same principles.
The five-wave cycle can also be extended to include the next corrective wave which is labelled A, B and C. This eight-wave cycle will then form wave 1 and 2 or wave 3 and 4 of a larger impulse wave, or two waves of a larger corrective wave.
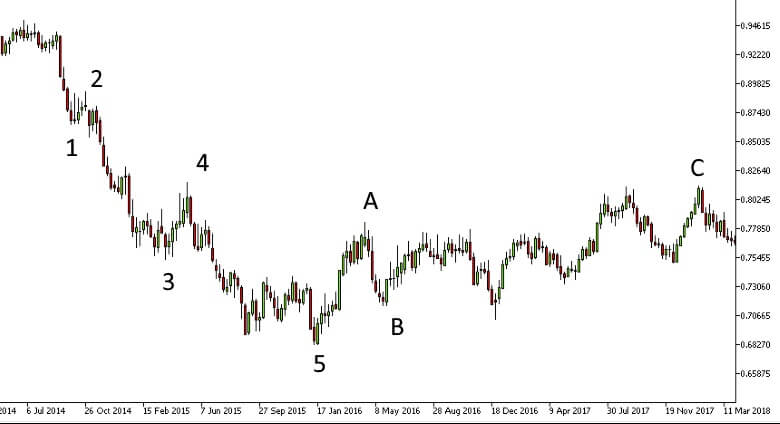
The charts shown above are simplified. In the real-world Elliott, wave counting is more complicated and takes practice to master. The following example is a weekly chart of the AUDUSD with an eight-wave cycle labelled.
Fibonacci Retracements and Projections
Fibonacci ratios have numerous applications in trading, and also play a key role in Elliot Wave analysis. The most important ratios that are used to identify likely retracement targets are 0.618, 0.5, 0.382, and 0.236. In addition, the ratios 1.618 and 2.618 are used to identify potential targets and retracement levels.
Corrective Waves
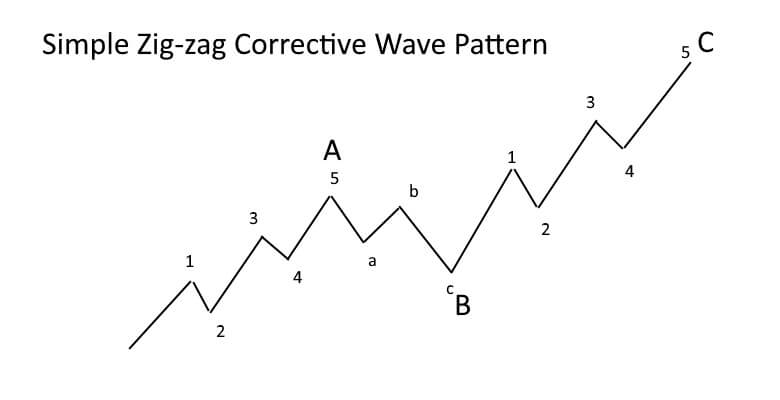
While impulse waves are fairly straight forward, corrective waves can be very complex and are more difficult to count until they are complete. There six basic corrective patterns, ranging from the simple zig-zag to more complicated flats, triangles and combinations. Corrective patterns are made up of a combination of smaller three or five wave patterns. They are identified by the sequence of 5 and 3 wave patterns, how much of the previous wave they correct, and the personality of each wave.
Corrective patterns
Corrective patterns will be covered in more detail in further tutorials, but for now, we include a simple zig-zag pattern as an example. A zig-zag correction is labelled ABC. It’s made up of a five-wave impulse sequence, followed by a three-wave corrective sequence. It is then followed by another five-wave impulse sequence.
Summary about Elliott Wave Theory
Elliott Wave Theory is a useful tool to identify likely scenarios and potential trades with positive expectancy. Besides the principles outlined in this introduction, there are several other guidelines that can be used to narrow down possible scenarios. In addition, several indicators can be used to characterize wave personality and potential reversal levels.
Future tutorials will cover these guidelines and other tools that can be used to identify the likely wave count at each point in time.