
Demystifying the Commodity Channel Index (CCI) on TradingView Platform

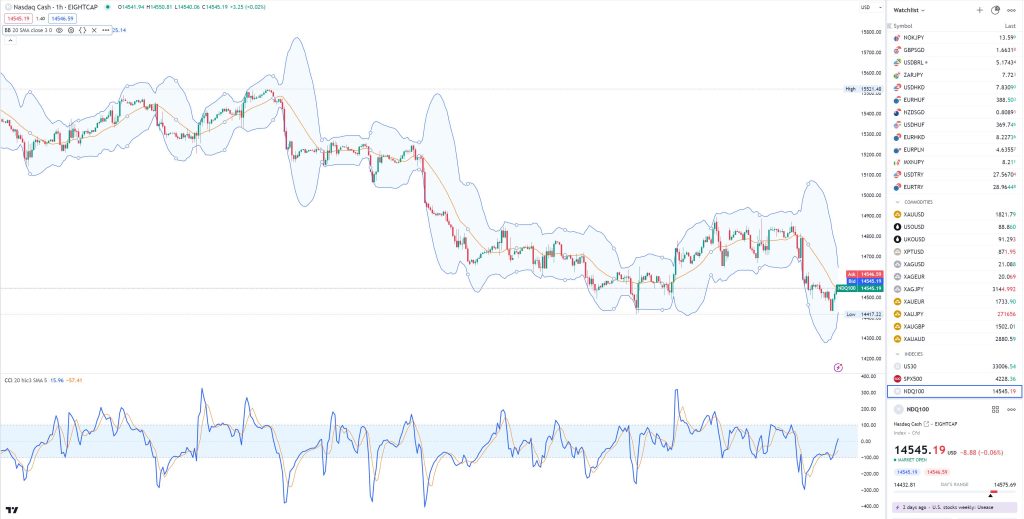
The Commodity Channel Index (CCI) is a powerful tool that can provide critical insights into market dynamics. Developed by Donald Lambert in the late 1970s, the CCI is a versatile momentum oscillator with applications across various financial markets. This guide is tailored specifically for TradingView users, aiming to unravel the intricacies of the CCI, including its underlying principles, calculation, interpretation, and practical applications within the platform.
I. Understanding the Commodity Channel Index (CCI)
- Concept and Purpose
TradingView users will find the Commodity Channel Index invaluable for identifying overbought and oversold conditions, as well as gauging the strength and direction of a trend. It is not bound by a specific range, allowing it to adapt to various market conditions seamlessly.
- Calculation
By default, the CCI is calculated using the following steps:
- Calculate the Typical Price (TP) for a given period
- Calculate the Simple Moving Average (SMA) of the Typical Price over the chosen period.
- Calculate the Mean Deviation (MD) of the Typical Price from the SMA.
II. Interpreting the Commodity Channel Index on TradingView
- Overbought and Oversold Levels:
On TradingView, the CCI employs thresholds of +100 and -100 to denote overbought and oversold conditions. Understanding these levels is crucial for traders:
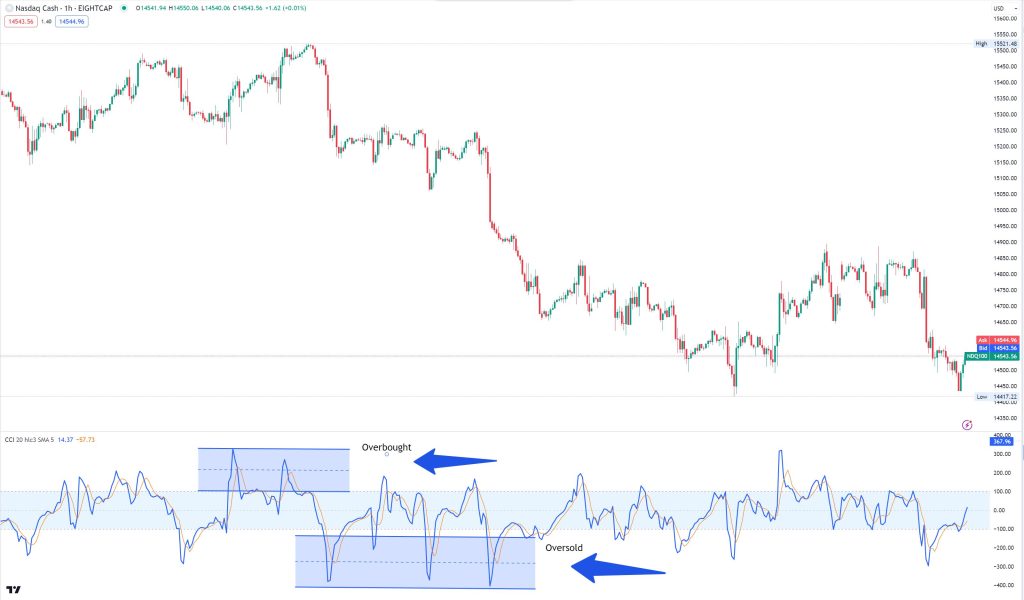
- Overbought (+100): When the CCI crosses above +100, it suggests that an asset may be overbought, meaning it might be trading at a level higher than its intrinsic value. This could indicate a potential reversal or a slowdown in the current trend. Traders might consider taking profits or looking for bearish confirmation signals.
- Oversold (-100): Conversely, when the CCI falls below -100, it implies that an asset may be oversold, potentially trading below its intrinsic value. This could suggest a potential buying opportunity or a reversal of the current downtrend. Traders might consider looking for bullish confirmation signals.
- Divergence:
Divergence is a powerful concept when interpreting the CCI on TradingView. It occurs when the price action of an asset and the CCI indicator move in opposite directions. There are two types:
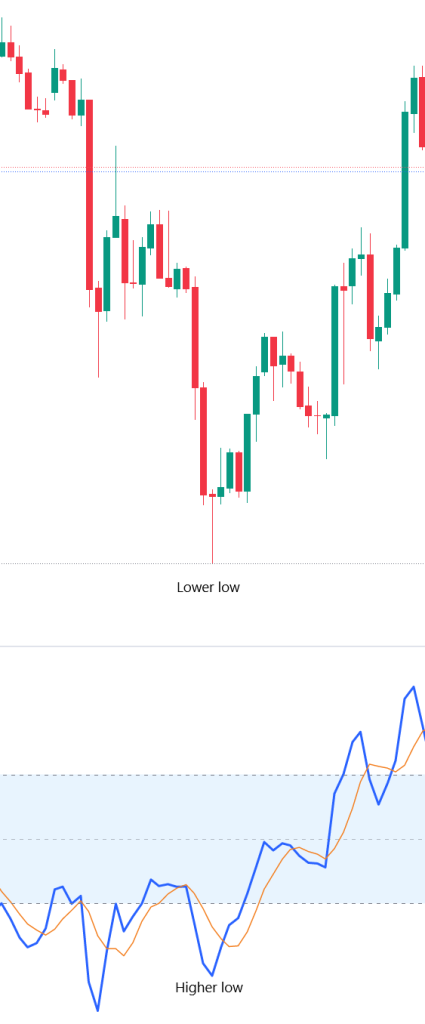
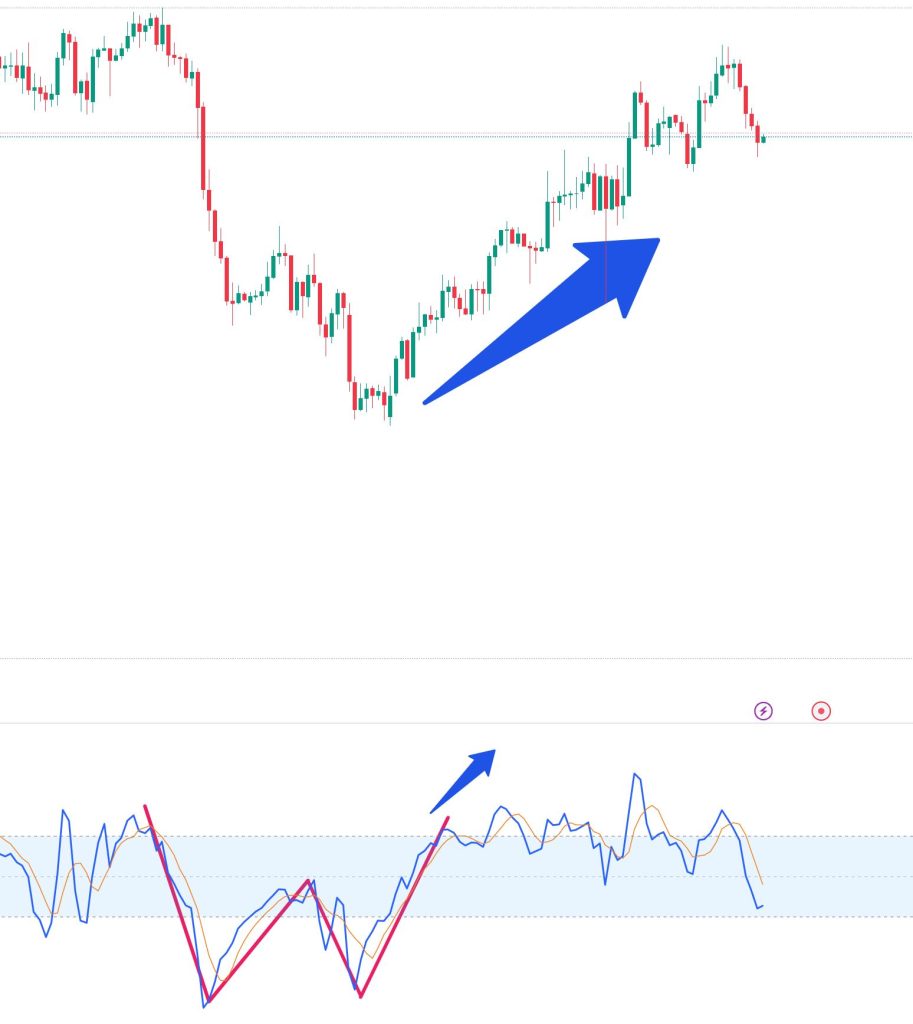
- Bullish Divergence: This occurs when the price of an asset forms lower lows while the CCI forms higher lows. It suggests that while prices are showing weakness, the momentum is actually strengthening. This could indicate a potential upward reversal.
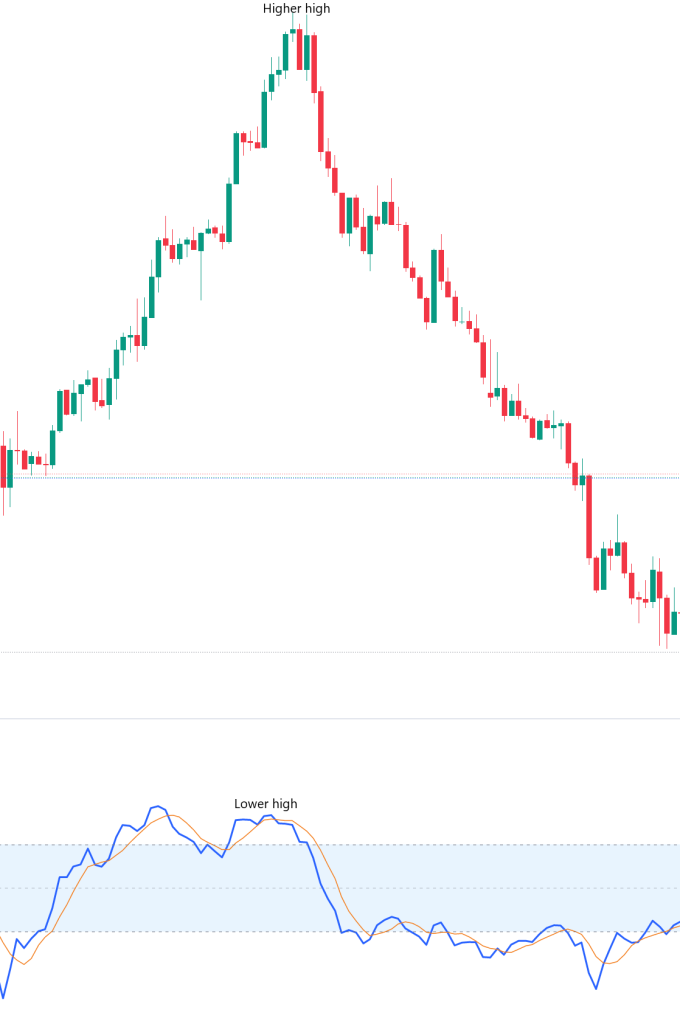
- Bearish Divergence: This occurs when the price of an asset forms higher highs while the CCI forms lower highs. It suggests that even though prices are rising, momentum is waning. This could signal a potential downward reversal.
Divergence can be a strong signal for traders to pay attention to potential trend changes.
- Distinguishing CCI Patterns:
TradingView users can benefit from recognizing specific patterns within the CCI indicator:
- Zero Line Crosses: When the CCI crosses above zero, it implies a potential shift from a bearish to a bullish trend. Conversely, when it crosses below zero, it suggests a potential shift from a bullish to a bearish trend.
- CCI Trendline Breaks: Drawing trendlines on the CCI indicator can reveal crucial points of support and resistance. Breaks of these trendlines can signal potential trend reversals or continuations.
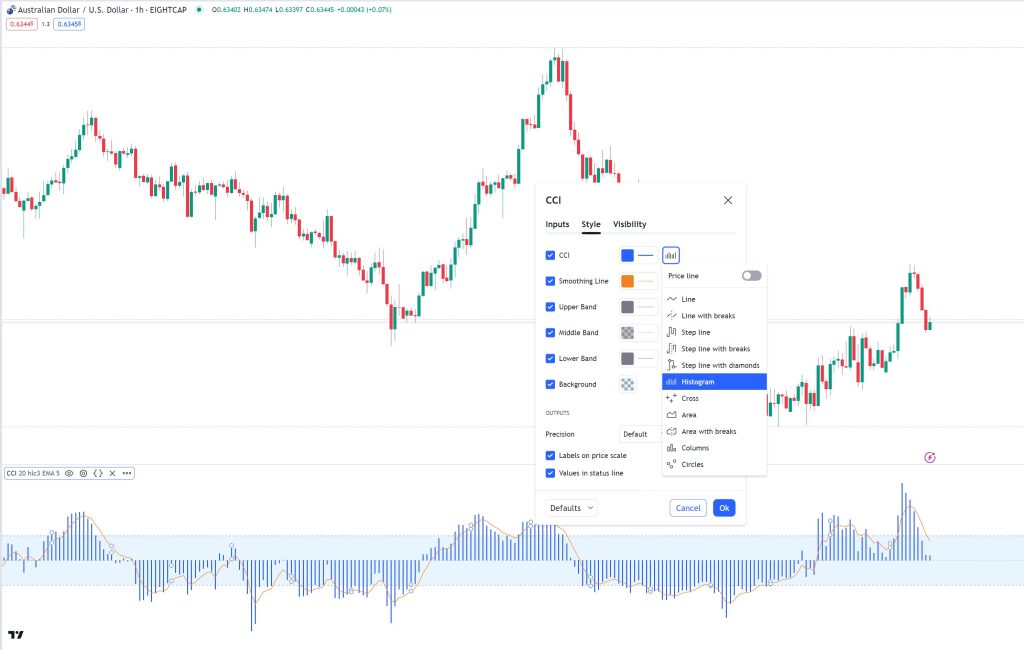
- CCI Histogram Patterns: The CCI histogram on TradingView can provide additional visual cues. For instance, a series of rising or falling bars may indicate strengthening or weakening momentum.
- Time Frame Considerations:
TradingView users have the flexibility to adjust time frames, influencing the sensitivity of the CCI indicator. Shorter time frames (e.g., 14, 20) provide more sensitive signals but may generate more false positives. Longer time frames (e.g., 50, 100) produce smoother, less frequent signals, potentially offering more reliable confirmation.
III. Practical Applications of the Commodity Channel Index on TradingView
Let us go into the practical applications of the CCI within the TradingView environment, offering traders actionable insights for their trading strategies.
- Trend Identification:
Utilizing the CCI on TradingView assists traders in identifying trends:
- Positive Values Above Zero: When the CCI remains consistently above zero, it indicates a strong upward trend. This signifies sustained buying pressure.
- Negative Values Below Zero: Conversely, when the CCI stays below zero, it suggests a pronounced downward trend, reflecting persistent selling pressure.
2. Volatility Measurement:
The CCI on TradingView is an excellent tool for gauging market volatility:
- Wide Swings: A CCI that oscillates with large swings signifies heightened volatility. This can be a crucial factor for traders to consider in their risk management strategies.
- Narrow Ranges: Conversely, when the CCI exhibits narrower ranges, it indicates lower volatility. This could be indicative of a consolidation phase or a market preparing for a potential breakout.
3. Identifying Potential Reversals:
The CCI on TradingView is adept at spotting potential reversal points:
- Divergence Confirmation: When divergences occur between the CCI and price action, they can be powerful indicators of an impending reversal. For example, bullish divergence indicates a potential upward reversal, while bearish divergence suggests a potential downward reversal.
- CCI Crosses Above/Below Zero: Crosses above zero can signal a shift from a bearish to a bullish trend, while crosses below zero can indicate a shift from a bullish to a bearish trend.
4. Fine-tuning Entry and Exit Points:
TradingView users can employ the CCI to refine their entry and exit strategies:
- Overbought and Oversold Conditions: When the CCI reaches extreme levels, it can indicate potential exhaustion in the current trend. Overbought conditions may signal a potential sell opportunity, while oversold conditions may indicate a potential buy opportunity.
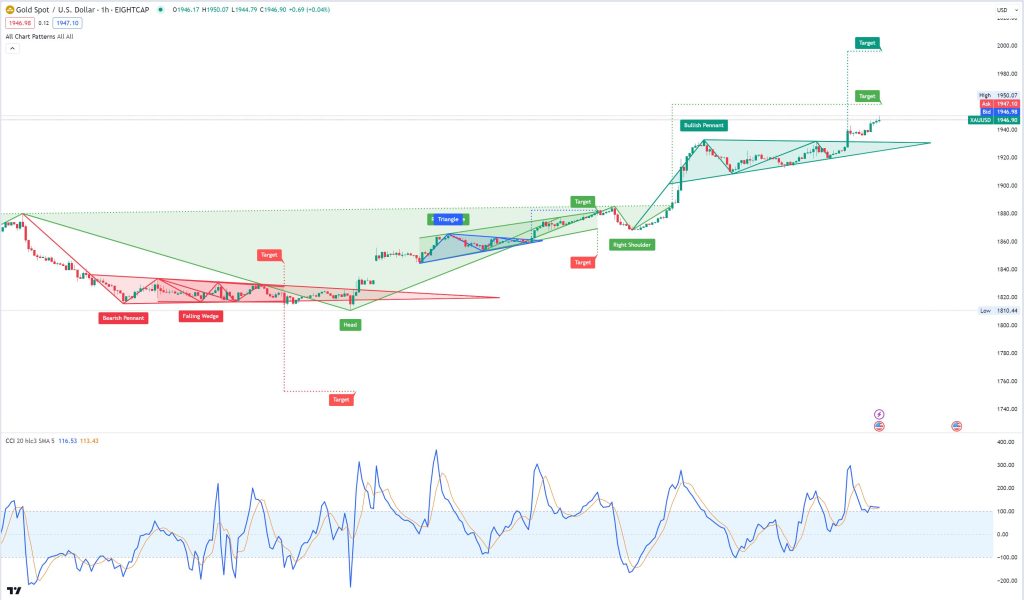
- CCI Patterns and Breakouts: Chart patterns, like head and shoulders formations, coupled with CCI confirmation, can be powerful signals for entry or exit points.
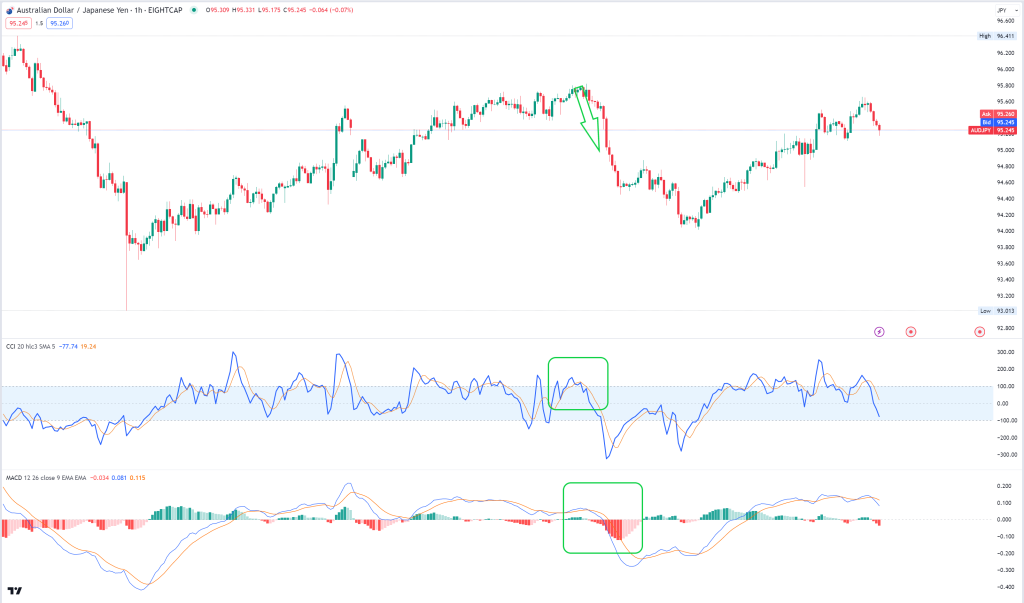
5. Confirmation with Other Indicators:
TradingView offers a range of complementary indicators that can be used in conjunction with the CCI:
- Moving Averages: Combining the CCI with moving averages can provide additional confirmation of trend direction and strength.
- MACD and RSI: These indicators, when used alongside the CCI, can offer a more comprehensive view of market conditions, providing multiple layers of confirmation.
6. Adaptation to Different Time Frames:
TradingView users have the flexibility to adjust time frames, influencing the sensitivity of the CCI. Shorter time frames offer more frequent but potentially less reliable signals, while longer time frames provide smoother, potentially more reliable signals.
IV. Customizing the CCI on TradingView
TradingView allows users to easily customize the CCI indicator. The default period for the CCI is 20, but traders can adjust this parameter based on their trading style and the time frame they are analyzing. Shorter periods provide more sensitive signals, while longer periods offer smoother, less frequent signals.
- Adjusting the Period:
The default period of 20 on the CCI is a solid starting point, but don’t be afraid to experiment. Shorter periods, like 14 or 10, offer more sensitive signals, which can be invaluable for active traders looking for immediate insights. Conversely, longer periods, such as 50 or 100, provide smoother, less frequent signals.
- Fine-tuning Overbought and Oversold Levels:
TradingView enables you to set your own overbought and oversold levels. Consider adjusting these thresholds to match your risk tolerance and trading strategy. Raising the overbought level (e.g., to +150) can lead to fewer, but potentially more substantial, sell signals. Lowering the oversold level (e.g., to -150) reduces the frequency of oversold signals, potentially resulting in more impactful buy signals.
- Incorporating Moving Averages:
Overlaying moving averages onto the CCI indicator provides additional context. Simple Moving Averages (SMA) smooth out the line, making it easier to identify trends and potential reversals. Exponential Moving Averages (EMA) give more weight to recent data, providing a more responsive indicator.
- Drawing Trendlines and Identifying Patterns:
Take advantage of TradingView’s drawing tools to add trendlines on the CCI. Recognizing and interpreting these patterns can offer valuable insights. Trendline breaks can signal potential trend reversals or continuations, while identifying support and resistance levels on the CCI can aid in setting effective stop-losses and take-profit levels.
- Experimenting with Time Frames:
TradingView’s flexibility in adjusting time frames is a game-changer. Lower time frames (e.g., 5-minute, 15-minute) provide more sensitive signals, ideal for day traders. Higher time frames (e.g., daily, weekly) generate smoother, less frequent signals.
V. Pitfalls and Considerations for Eightcap’s TradingView Users
While the CCI is a powerful tool, Eightcap’s TradingView users should be cautious of relying solely on it for trading decisions. It is advisable to incorporate it into a comprehensive trading strategy that includes other technical and fundamental analysis tools available on the platform.
In the world of trading, precision and adaptability are key, and the Commodity Channel Index (CCI) on TradingView can assist with both. As traders, you have at your fingertips a versatile tool that can be fine-tuned to your specific needs, and the CCI’s customization options can cater to your trading style.
At Eightcap, we understand the importance of informed trading decisions, and the CCI on TradingView is a valuable asset in your arsenal. As you navigate the financial markets, remember that the CCI, when used alongside your comprehensive trading strategy, can provide more clarity and insights needed to enhance your trading experience. Harness its power and customize it to your liking.
* The information provided here has been prepared by Eightcap’s team of analysts. All expressions of opinion are subject to change without notice. Any opinions made may be personal to the author and do not reflect the opinions of Eightcap.
In addition to the disclaimer on our website, the material on this page does not contain a record of our trading prices, or represent an offer or solicitation for a transaction in any financial instrument. Eightcap accepts no responsibility for any use that may be made of these comments and for any consequences that result. No representation or warranty is given as to the accuracy or completeness of this information. Consequently, any person acting on it does so entirely at their own risk. Any research provided does not have regard to the specific investment objectives, financial situation and needs of any specific person who may receive it. It has not been prepared in accordance with legal requirements designed to promote the independence of investment research and as such is considered to be a marketing communication.
Please note that past performance is not a guarantee or prediction of future performance. This communication must not be reproduced or further distributed without prior permission.