
Exploring The Most Common Entry Point Indicators on TradingView


Entry point indicators can assist traders in identifying favorable moments to enter a trade and maximize potential profits. TradingView, a popular charting platform and also Eightcap’s partner, offers a wide range of indicators that can help traders make informed decisions.
In this article, we will delve into some of the most common entry point indicators available on TradingView and provide examples to showcase their application.
Moving Averages (MA)
Moving averages are widely used entry point indicators that help identify trends and potential support or resistance levels. Two common types of moving averages are the Simple Moving Average (SMA) and the Exponential Moving Average (EMA). Traders often look for bullish or bearish crossovers between different moving averages as entry signals.
Relative Strength Index (RSI)
The Relative Strength Index is a momentum oscillator that measures the speed and change of price movements. It ranges from 0 to 100 and helps traders identify overbought or oversold conditions. A common entry strategy is to look for RSI values below 30 for potential buy signals and above 70 for potential sell signals.
Bollinger Bands
Bollinger Bands consist of a moving average, an upper band, and a lower band. They help traders assess volatility and potential price breakouts. When the price touches or penetrates the lower band, it may indicate an oversold condition and a potential buying opportunity. Conversely, when the price touches or breaches the upper band, it may signal an overbought condition and a potential selling opportunity.
Example: “When the price touches the lower Bollinger Band and the RSI is below 30, it suggests a potential buy signal. Traders can consider entering a long position when the price rebounds from the lower band and the RSI starts to rise.”
MACD (Moving Average Convergence Divergence)
The MACD indicator helps traders identify potential trend reversals and market momentum. It consists of two lines, the MACD line and the signal line, as well as a histogram. Bullish entry signals are often generated when the MACD line crosses above the signal line, indicating upward momentum, while bearish signals occur when the MACD line crosses below the signal line.
Custom Entry Point Indicators on TradingView
TradingView has gained significant popularity as a versatile platform for traders to analyze markets and execute trades. One of the key features that make TradingView stand out is its ability to integrate custom indicators created by the trading community. These custom entry point indicators empower traders to make more informed decisions based on their unique strategies. In this article, we’ll explore some of the best custom entry point indicators available on TradingView, along with detailed explanations and examples.
SuperTrend
The SuperTrend indicator is a widely used trend-following indicator that helps traders identify potential entry points during trending markets. It provides dynamic support and resistance levels that adjust based on market volatility. When the price is above the SuperTrend line, it signals a potential bullish entry, and when below, it suggests a bearish entry.
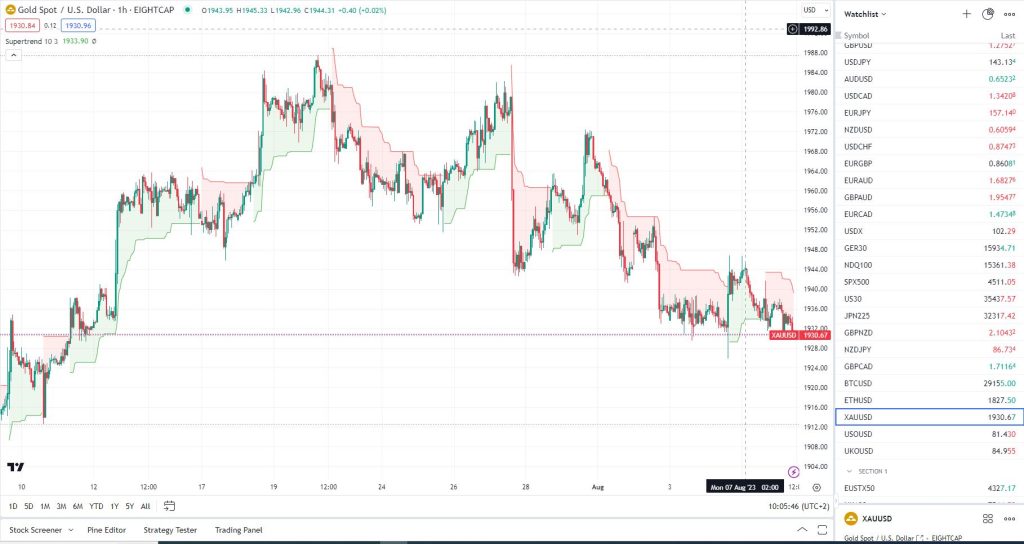
Functionality: The SuperTrend indicator combines price and volatility to create dynamic support and resistance levels. It adapts to changes in market conditions, making it ideal for identifying potential entry points during trending markets.
Time Frame: SuperTrend can be used across various time frames, from short-term intraday charts (e.g., 5-minute or 15-minute) to longer-term charts (e.g., daily or weekly). Its adaptability makes it suitable for both scalping and swing trading strategies.
Buy Entry Point: On a 15-minute chart of a stock, if the price is consistently trading above the rising SuperTrend line and there’s a pullback that touches or slightly breaches the SuperTrend without crossing it, it can indicate a potential buy entry. This suggests that the trend is likely to continue.
Sell Entry Point: If the price has been trading below the falling SuperTrend line and a brief bounce occurs that reaches or slightly surpasses the SuperTrend without breaking it, this could be a sell entry opportunity. It suggests that the downtrend might persist.
Moving Average Convergence Divergence (MACD) Histogram
The MACD Histogram is a modification of the classic MACD indicator. It represents the difference between the MACD line and the signal line. A positive MACD Histogram suggests increasing bullish momentum, while a negative histogram indicates growing bearish momentum.
Functionality: The MACD Histogram is derived from the MACD line and the signal line. It indicates the momentum and strength of a trend, helping traders identify potential entry points based on changes in momentum.
Time Frame: MACD Histogram can be effective across multiple time frames, but it’s particularly useful on shorter time frames (e.g., 1-hour or 4-hour) for identifying short-term momentum shifts.
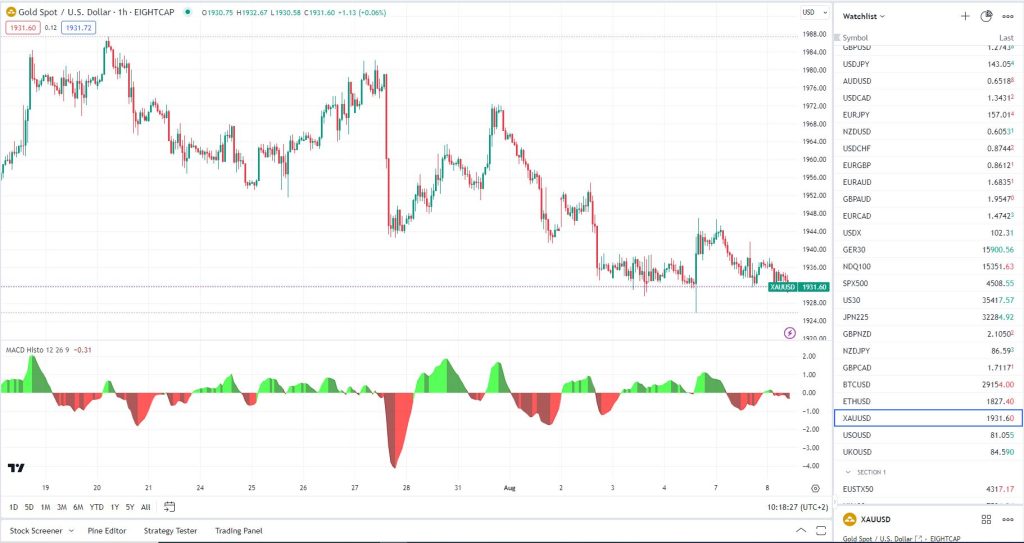
Buy Entry Point: Consider a 1-hour chart of a currency pair. If the MACD Histogram turns positive and starts expanding after a period of negative values, it might signal an entry point. This indicates that bullish momentum is increasing, potentially leading to a price rise.
Sell Entry Point: On a 1-hour chart of an index, if the price forms a higher high, but the RSI forms a lower high, this bearish divergence could indicate a potential trend reversal. It suggests that even though price increased, momentum is weakening.
While TradingView offers a vast array of pre-built indicators, sometimes traders prefer to create their own custom entry point indicators tailored to their specific trading strategies. Custom indicators provide traders with flexibility and the ability to incorporate unique trading criteria. In this article, we will explore the process of building custom entry point indicators on TradingView and provide examples of how they can be used effectively.
Relative Strength Index (RSI) Divergence
While RSI is a well-known momentum oscillator, traders often use RSI divergence to identify potential reversals. When the price forms a higher high but the RSI forms a lower high (bearish divergence) or vice versa (bullish divergence), it suggests a potential entry point.
Functionality: RSI divergence involves comparing price action with the RSI indicator. Bullish divergence occurs when price forms a lower low while RSI forms a higher low, suggesting potential upward price movement. Bearish divergence is the opposite.
Time Frame: RSI divergence can be applied to various time frames, with the choice depending on your trading strategy. It’s commonly used on hourly, 4-hour, and daily charts for identifying reversals.
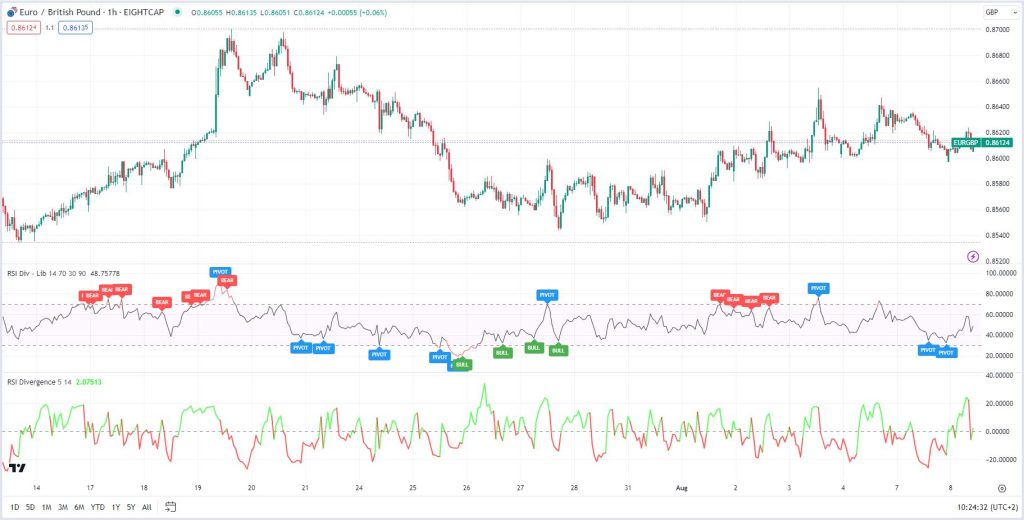
Buy Entry Point: Imagine a daily chart of a cryptocurrency. If the price forms a lower low, but the RSI indicator forms a higher low, this bullish divergence could indicate an upcoming trend reversal. It suggests that even though price declined, momentum is still positive.
Sell Entry Point: On a 1-hour chart of an index, if the price forms a higher high, but the RSI forms a lower high, this bearish divergence could indicate a potential trend reversal. It suggests that even though price increased, momentum is weakening.
Bollinger Bands Squeeze
The Bollinger Bands indicator is known for measuring volatility. A Bollinger Bands squeeze occurs when the bands narrow, indicating reduced volatility. This often precedes a significant price movement.
Functionality: The Bollinger Bands indicator consists of a central moving average and two standard deviation lines above and below it. A squeeze occurs when the bands narrow, indicating decreased volatility and the potential for an upcoming breakout.
Time Frame: Bollinger Bands squeezes are often seen on shorter time frames (e.g., 15-minute, 30-minute) and can provide insights for both short-term and intraday trading strategies.
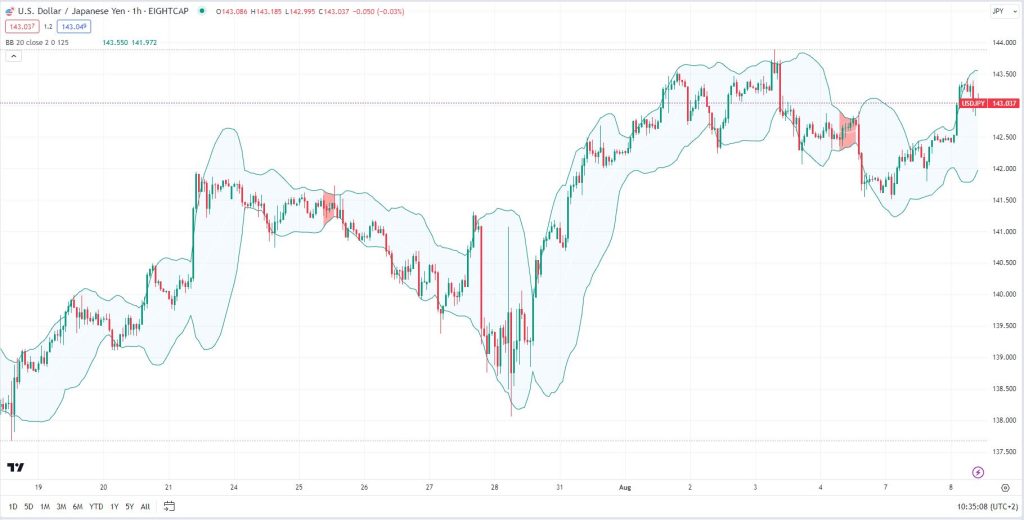
Buy Entry Point: On a 30-minute chart of a forex pair, if the Bollinger Bands contract and the price subsequently breaks above the upper band with strong momentum, it could indicate a buy entry point. The breakout suggests the potential start of an uptrend.
Sell Entry Point: Imagine a 1-hour chart of a cryptocurrency. If the Bollinger Bands contract and the price breaks below the lower band with significant momentum, it might signal a sell entry point. The breakout suggests the potential beginning of a downtrend.
Custom-built entry point indicators available on TradingView platform allow traders to adapt their strategies and incorporate specific criteria that align with their trading styles.
By creating custom moving average crossovers, oscillator divergences, or support and resistance breakout indicators, traders can gain a deeper understanding of the market and identify entry opportunities with greater precision.
* The information provided here has been prepared by Eightcap’s team of analysts. All expressions of opinion are subject to change without notice. Any opinions made may be personal to the author and do not reflect the opinions of Eightcap.
In addition to the disclaimer on our website, the material on this page does not contain a record of our trading prices, or represent an offer or solicitation for a transaction in any financial instrument. Eightcap accepts no responsibility for any use that may be made of these comments and for any consequences that result. No representation or warranty is given as to the accuracy or completeness of this information. Consequently, any person acting on it does so entirely at their own risk. Any research provided does not have regard to the specific investment objectives, financial situation and needs of any specific person who may receive it. It has not been prepared in accordance with legal requirements designed to promote the independence of investment research and as such is considered to be a marketing communication.
Please note that past performance is not a guarantee or prediction of future performance. This communication must not be reproduced or further distributed without prior permission.