
The Most Accurate Indicators for Scalpers on TradingView – how to set them and how to use them. (Part Two)


Welcome back to our two-part series on advanced scalping techniques. In Part One, we explored a range of powerful indicators including Moving Averages, Bollinger Bands, Relative Strength Index (RSI), Stochastic Oscillator, and Fibonacci Retracement, and delved into practical examples of how they can be utilized for efficient scalping. If you haven’t had the chance to read Part One, we highly recommend doing so to grasp the foundational concepts that will be built upon in this installment.
In Part Two, we’re delving deeper into the world of advanced scalping by introducing two additional powerhouse indicators: the Ichimoku Cloud and the Stochastic Oscillator. These indicators bring a wealth of information about support, resistance, trend direction, and market momentum. By combining these tools, you’ll have at your disposal a dynamic approach to navigating fast-paced markets. We’ll be providing real-world examples and detailed insights into how these indicators can elevate your trading endeavors. Let’s dive in!
Combination 3: Stochastic Oscillator with Fibonacci Retracement
Indicators:
- Stochastic Oscillator:
- %K Period: 5
- %D Period: 3
Settings:
- The stochastic oscillator helps identify overbought and oversold conditions, providing potential entry or exit points.
- Fibonacci Retracement Levels:
- Draw retracement levels based on recent price action.
Rationale:
- Look for stochastic oscillator crossovers or extreme levels, indicating potential reversals.
- Combine this with Fibonacci retracement levels to identify potential support or resistance zones.
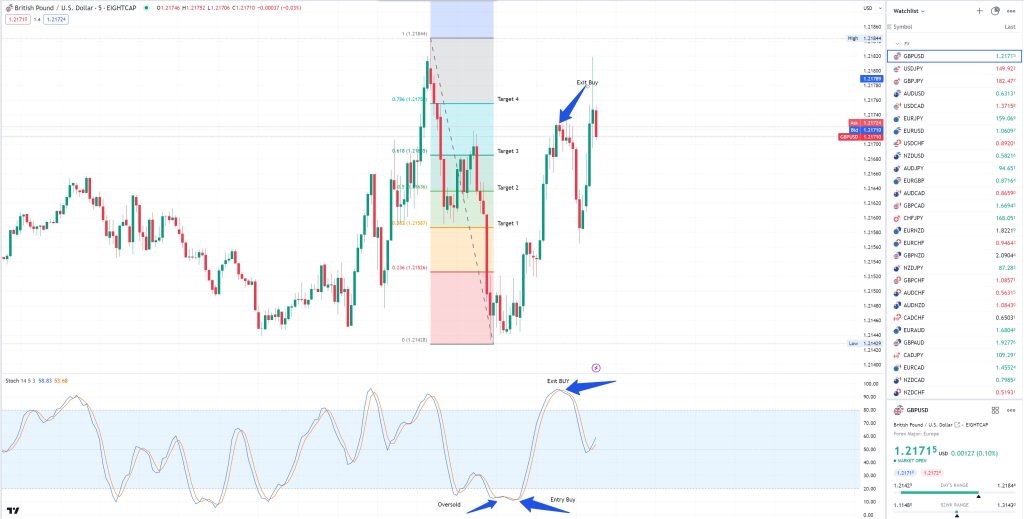
Buy Example:
- Stochastic Oscillator Signal:
- The %K line (in blue) crosses above the %D line (in red), indicating potential bullish momentum.
- Fibonacci Support Confirmation:
- The price retraces to a Fibonacci support level (e.g., 38.2% or 50%), providing a potential entry point.
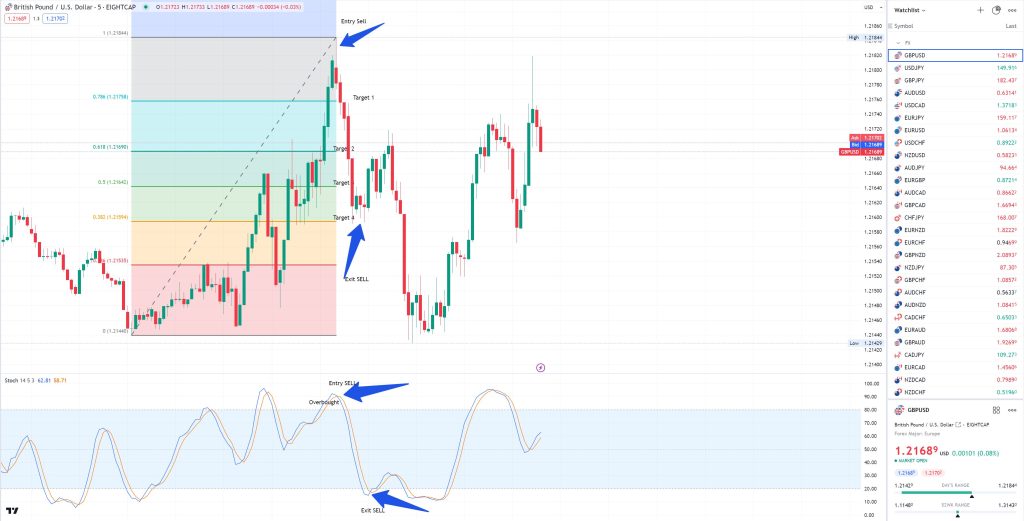
Sell Example:
- Stochastic Oscillator Signal:
- The %K line (in blue) crosses below the %D line (in red), indicating potential bearish momentum.
- Fibonacci Resistance Confirmation:
- The price retraces to a Fibonacci resistance level (e.g., 61.8% or 78.6%), providing a potential exit point.
Combination 4: Ichimoku Cloud with Volume Profile
Indicators:
- Ichimoku Cloud:
- Components:
- Tenkan-sen (Conversion Line)
- Kijun-sen (Base Line)
- Senkou Span A (Leading Span A)
- Senkou Span B (Leading Span B)
- Kumo (Cloud)
- Settings: Default settings are often used.
- Components:
Rationale:
- The Ichimoku Cloud provides comprehensive information about support and resistance levels, trend direction, and momentum. It can be a powerful tool for scalpers.
- Volume Profile:
- Displays trading activity at various price levels.
- Volume Profile helps identify areas of high liquidity, which can act as support or resistance zones. This is particularly useful in fast-moving markets.
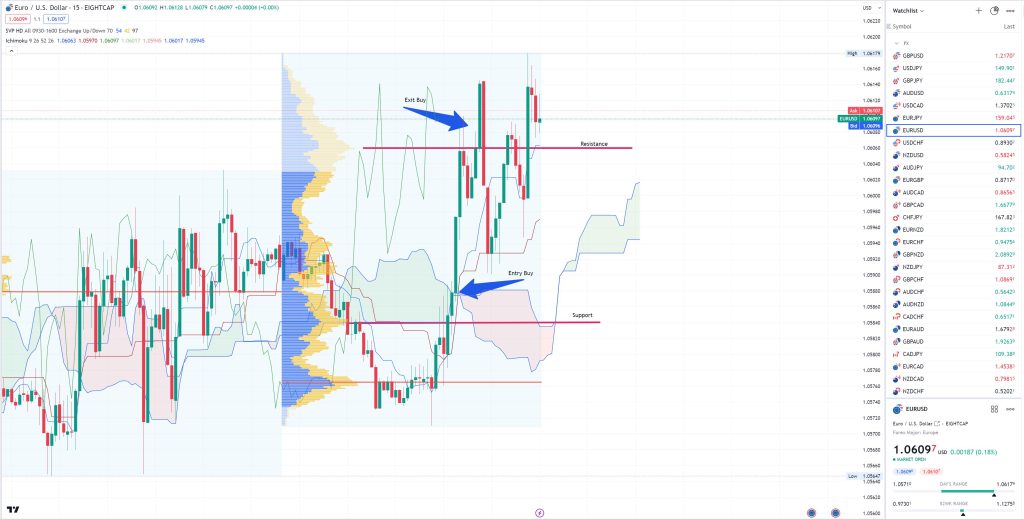
Buy Example:
- Ichimoku Cloud Signal:
- The price is above the Kumo (Cloud), indicating a potential bullish trend.
- Volume Profile Confirmation:
- The Volume Profile shows a concentration of trading activity at a specific price level, further confirming potential support.
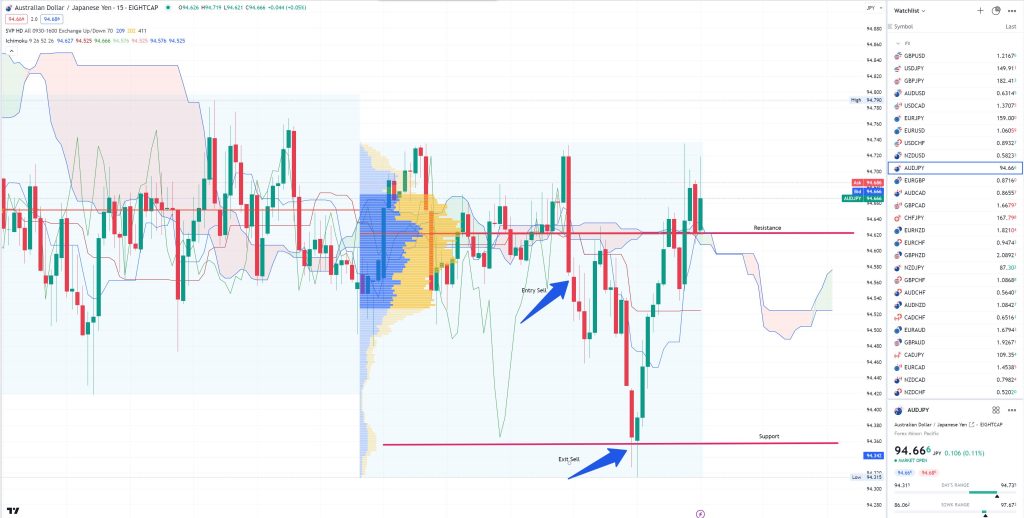
Sell Example:
- Ichimoku Cloud Signal:
- The price is below the Kumo (Cloud), indicating a potential bearish trend.
- Volume Profile Confirmation:
- The Volume Profile shows a concentration of trading activity at a specific price level, further confirming potential resistance.
Combination 5: Ichimoku Cloud with Stochastic Oscillator
Indicators:
- Ichimoku Cloud:
- Components:
- Tenkan-sen (Conversion Line)
- Kijun-sen (Base Line)
- Senkou Span A (Leading Span A)
- Senkou Span B (Leading Span B)
- Kumo (Cloud)
- Settings: Default settings are often used.
- Components:
Rationale:
- The Ichimoku Cloud provides comprehensive information about support and resistance levels, trend direction, and momentum. It can be a powerful tool for scalpers.
- Stochastic Oscillator:
- %K Period: 5
- %D Period: 3
Settings:
- The stochastic oscillator helps identify overbought and oversold conditions, providing potential entry or exit points.
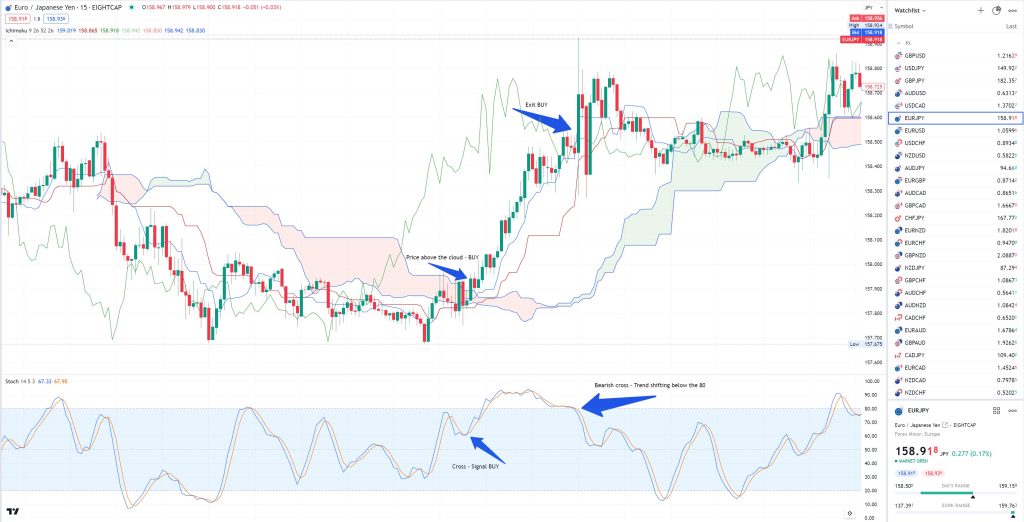
Buy Example:
- Ichimoku Cloud Signal:
- The price is above the Kumo (Cloud), indicating a potential bullish trend.
- Stochastic Oscillator Signal:
- The %K line (in blue) crosses above the %D line (in red), indicating potential bullish momentum.
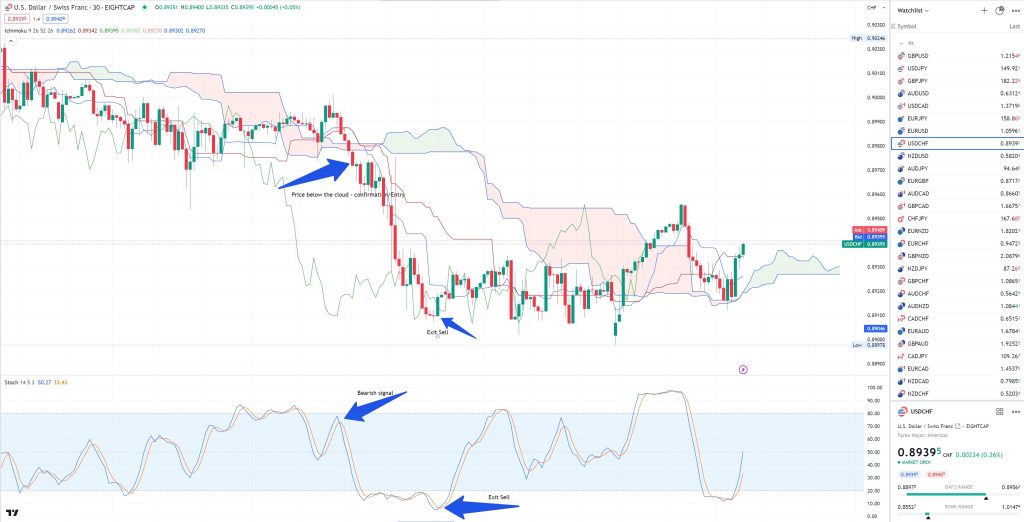
Sell Example:
- Ichimoku Cloud Signal:
- The price is below the Kumo (Cloud), indicating a potential bearish trend.
- Stochastic Oscillator Signal:
- The %K line (in blue) crosses below the %D line (in red), indicating potential bearish momentum.
Incorporating the Ichimoku Cloud and Stochastic Oscillator into your scalping toolkit can provide you with a multi-dimensional perspective on market dynamics. The Ichimoku Cloud’s holistic view of price action coupled with the Stochastic Oscillator’s ability to identify overbought and oversold conditions create a potent combination for nimble traders. Remember to practice these techniques in a demo environment before implementing them with real capital. Stay disciplined, follow your risk management strategies, and always keep refining your approach.
With dedication and skill, these advanced scalping techniques can become valuable assets in your trading repertoire.
* The information provided here has been prepared by Eightcap’s team of analysts. All expressions of opinion are subject to change without notice. Any opinions made may be personal to the author and do not reflect the opinions of Eightcap.
In addition to the disclaimer on our website, the material on this page does not contain a record of our trading prices, or represent an offer or solicitation for a transaction in any financial instrument. Eightcap accepts no responsibility for any use that may be made of these comments and for any consequences that result. No representation or warranty is given as to the accuracy or completeness of this information. Consequently, any person acting on it does so entirely at their own risk. Any research provided does not have regard to the specific investment objectives, financial situation and needs of any specific person who may receive it. It has not been prepared in accordance with legal requirements designed to promote the independence of investment research and as such is considered to be a marketing communication.
Please note that past performance is not a guarantee or prediction of future performance. This communication must not be reproduced or further distributed without prior permission.