
Understanding the VROC Indicator on TradingView

In the fast-paced world of financial markets, traders rely on various technical indicators to make informed decisions. One such indicator is the Volume Rate of Change (VROC), available on the popular trading platform, TradingView. The VROC indicator is a powerful tool that helps traders assess changes in trading volume and potential price trends. In this article, we will delve into the details of the VROC indicator, its calculation, interpretation, and practical application in trading.
What is the VROC Indicator?
The Volume Rate of Change (VROC) indicator is a momentum-based technical analysis tool used to measure the rate of change in trading volume over a given period. It aids traders in identifying shifts in market sentiment and potential price movements. VROC is particularly effective for identifying bullish or bearish divergence, which can signal potential trend reversals or continuations.
Calculation of the VROC Indicator:
The VROC indicator is calculated using the following formula:
VROC = [(Current Volume – Volume n periods ago) / Volume n periods ago] * 100
Where:
- Current Volume: Trading volume during the current period.
- Volume n periods ago: Trading volume n periods ago.
The result is expressed as a percentage, indicating the percentage change in volume over the specified period.
Interpreting the VROC Indicator:
Interpreting the VROC indicator is crucial for traders. A positive VROC suggests an increase in volume, signaling potential bullish sentiment. Conversely, a negative VROC indicates a decrease in volume, suggesting bearish sentiment. Traders often use VROC in conjunction with other technical indicators to confirm trends and make more informed trading decisions.
Here’s how to interpret these values:
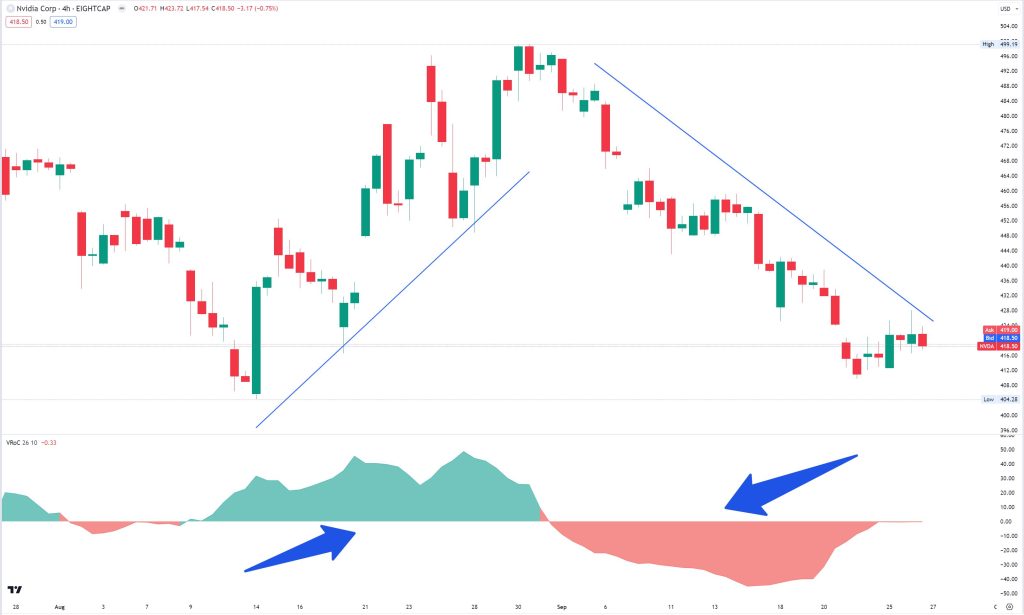
1. Positive VROC: A positive VROC value indicates that the current volume is higher than the volume n periods ago. This suggests increasing buying or selling interest and can signify a potential price trend continuation.
2. Negative VROC: A negative VROC value indicates that the current volume is lower than the volume n periods ago. This might signal decreasing buying or selling interest, hinting at a potential price trend reversal or weakening.
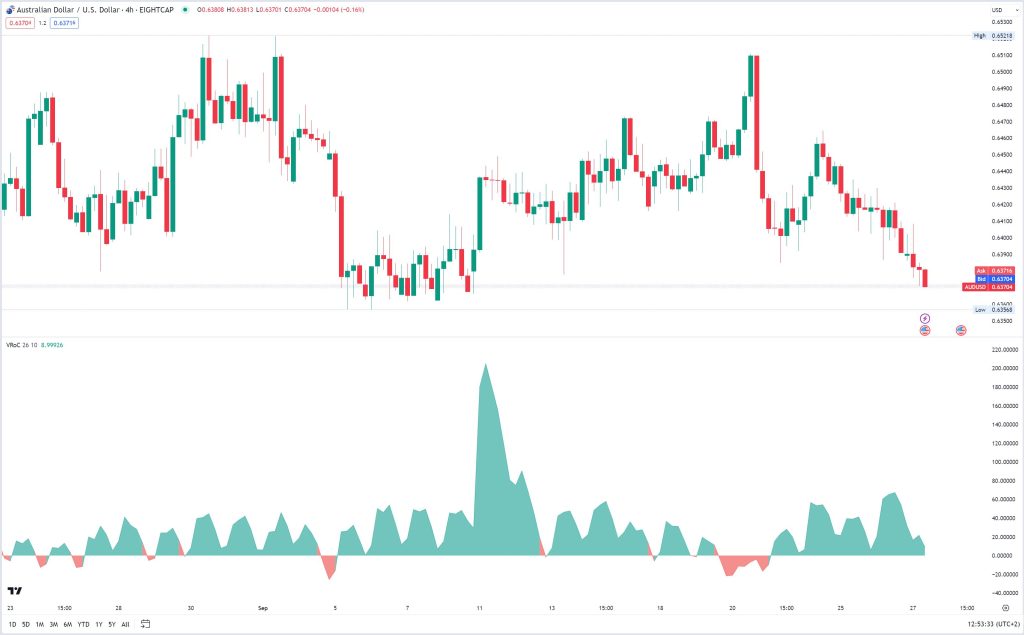
3. Around Zero VROC: When the VROC hovers around zero, it suggests that the current volume is relatively stable compared to the volume n periods ago. This could indicate a potential consolidation phase or a lack of significant changes in market sentiment.
Customizing VROC on TradingView
TradingView makes it easy for traders to add the VROC indicator to their charts. Simply locate the “Indicators and Strategies” section, search for “VROC,” and customize the settings to suit your preferences. You can adjust timeframes, change colors, and experiment with different smoothing methods to fine-tune your analysis.
- Accessing the Indicator:
- Open your TradingView chart.
- In the top-left corner, you’ll find the “Indicators and Strategies” button. Click on it to open the indicator menu.
- In the indicator menu, use the search bar to find the VROC indicator. Type “VROC” and select it from the results.
- Once you’ve selected the VROC indicator, it will appear on your chart. By default, it will use the standard settings.
- Customizing VROC Settings:
- To customize the VROC indicator, click on the gear icon or “Settings” in the indicator panel on your chart.
- You can adjust the timeframe on which the VROC indicator is calculated. This allows you to view VROC data on different timeframes, such as daily, hourly, or even minute charts. Select your desired timeframe from the options provided.
- Customize the appearance of the VROC line on your chart. You can change the line color, line style (e.g., solid or dashed), and line thickness according to your visual preferences.
- Smoothing Methods, Displaying Histogram and Overlays and Subcharts:
- VROC can be smoothed using various methods, such as Simple Moving Average (SMA) or Exponential Moving Average (EMA). Experiment with different smoothing methods to see which one aligns best with your trading strategy.
- Some traders prefer to view VROC as a histogram rather than a line. TradingView allows you to change the plot style to a histogram if that’s your preferred way of visualizing VROC.
- Decide whether you want to overlay the VROC indicator on the price chart or place it in a separate subchart below the price chart. This depends on your preference for chart organization.
- Saving Custom Presets and setting Alerts:
Once you’ve customized the VROC indicator to your liking, you can save your settings as a custom preset. This makes it easy to apply your preferred VROC settings to other charts in the future.
- If you want to receive notifications when specific VROC conditions are met, you can set up custom alerts. This is useful for staying informed of potential trading opportunities.
Using VROC in Trading:
The Volume Rate of Change (VROC) indicator’s utility extends across multiple trading strategies due to its ability to gauge changes in trading volume and their implications on price movements. Let’s delve deeper into how the VROC can be effectively used in trading:
Divergence Analysis:
Divergence is a critical concept in technical analysis that occurs when the price of an asset and an indicator move in opposite directions. The VROC indicator, in conjunction with price action, helps identify divergences that can signal potential shifts in market sentiment.
Divergences come in two main forms:
Bullish Divergence: Occurs when the price makes lower lows, but the VROC indicator forms higher lows. This could suggest that while the price is weakening, buying interest is growing, potentially foreshadowing a trend reversal to the upside.
Bearish Divergence: Occurs when the price forms higher highs, while the VROC indicator forms lower highs. This implies that the price might be overextended and due for a downward correction.
Confirming Breakouts:
Breakouts from key levels or chart patterns can be more reliable when accompanied by changes in trading volume. The VROC indicator can serve as a validation tool for breakout traders.
When a breakout occurs along with a surge in volume (positive VROC), it adds credibility to the breakout’s strength. This indicates that a significant number of market participants are supporting the price movement, increasing the probability that the breakout is genuine.
Identifying Trend Strength:
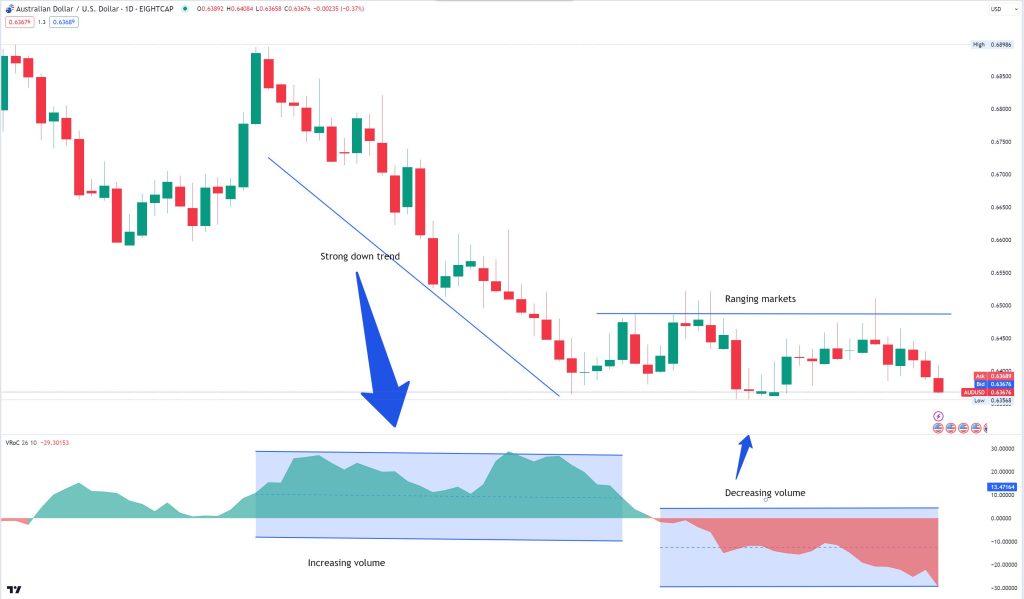
The VROC indicator can assist in assessing the strength of a prevailing trend by analyzing the consistency and magnitude of its values.
During an uptrend, consistently positive VROC values suggest that buying interest is growing as the price rises. This indicates a robust trend with sustained momentum. Similarly, in a downtrend, a consistent negative VROC signifies that selling pressure is persistent, reinforcing the downtrend’s vigor.
Volume Analysis:
VROC is valuable for understanding changes in market sentiment through shifts in trading volume. Analyzing volume patterns in relation to price movements can uncover hidden insights.
An increase in volume during price rallies can signify strong market conviction, validating the upward movement. Conversely, if the price falls on high volume (negative VROC), it suggests heightened selling pressure, potentially indicating a more substantial price decline.
Using VROC in Trading for Different Assets and Time Frames:
The effectiveness of the Volume Rate of Change (VROC) indicator can vary depending on the assets being traded and the time frames chosen. Different assets and time frames exhibit unique characteristics that influence how the VROC can be applied.
Let’s explore the optimal use of the VROC for different asset classes and time frames:
Equities and Stocks: Equity markets are often influenced by investor sentiment, news, and macroeconomic factors. The VROC indicator can be particularly useful in identifying shifts in market sentiment and potential trend changes. For stocks, the VROC can be effective on time frames ranging from intraday to daily charts.
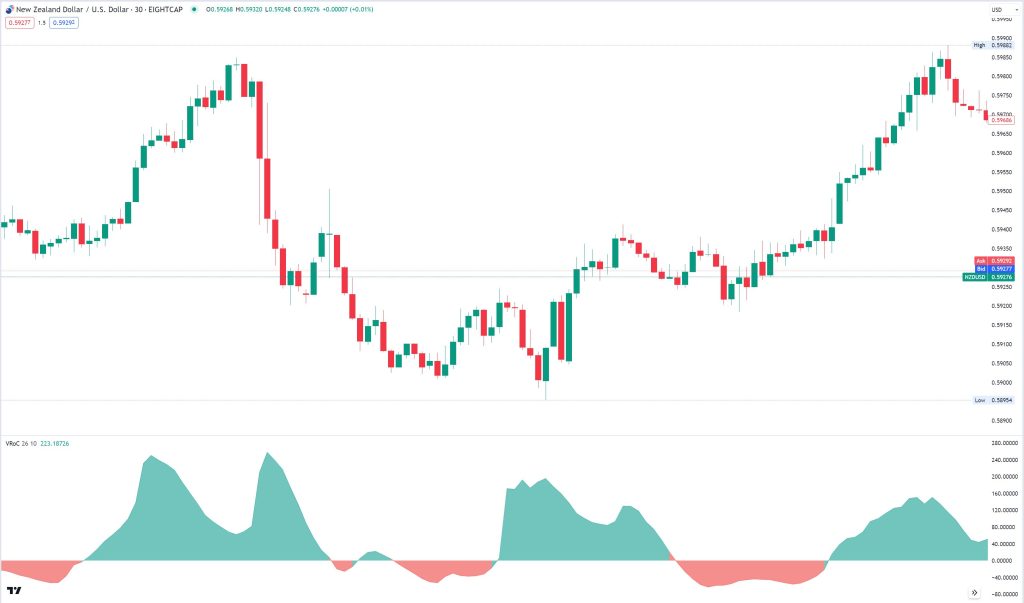
Forex (Foreign Exchange) Market: The forex market operates 24/5 and is driven by factors such as interest rates, economic indicators, and geopolitical events. The VROC can be valuable in forex trading, especially when used on shorter time frames like 15-minute, 30-minute, or 1-hour charts. These time frames allow traders to capture intraday volume changes that may indicate short-term trends or reversals.
Commodities: Commodity markets, including precious metals, energies, and agricultural products, can be influenced by supply and demand dynamics, global events, and geopolitical tensions. The VROC indicator can be applied effectively on various time frames depending on the commodity being traded. For instance, energy commodities like crude oil might respond well to the VROC on shorter time frames, while agricultural commodities like soybeans might exhibit clearer trends on daily or weekly charts.
Cryptocurrencies: Cryptocurrency markets are known for their volatility and can be influenced by technological developments, regulatory news, and market sentiment. The VROC indicator can be especially valuable in crypto trading due to its potential to identify rapid shifts in volume and sentiment. Short to medium time frames, such as 15-minute to 4-hour charts, can be appropriate for crypto trading using the VROC.
Indices: For widely followed indices like the NASDAQ 100, which includes technology-heavy companies, the VROC can be particularly insightful. In this context, shorter time frames such as 15-minute, 30-minute, or 1-hour charts can help traders identify rapid changes in volume associated with news releases, earnings reports, or market-moving events within the technology sector.
The FTSE 100, or the German DAX30, may respond well to the VROC indicator on both shorter and longer time frames. Shorter time frames can capture intraday fluctuations driven by economic data releases or geopolitical events, while longer time frames such as daily or weekly charts can reveal the overall sentiment of the UK or German stock markets.
Combining the VROC with additional indicators
The Volume Rate of Change (VROC) indicator can be enhanced and its effectiveness maximized when used in conjunction with certain other technical indicators. Combining the VROC with these indicators can provide traders with a more comprehensive view of market dynamics. Here are a few indicators that synergize well with the VROC:
1. Moving Averages (MAs): Combining the VROC with moving averages can help identify potential trend changes. When the VROC crosses above or below a moving average, it can signal shifts in trading volume momentum that might coincide with price trend reversals or continuations.
2. Relative Strength Index (RSI): RSI measures the magnitude of recent price changes and identifies overbought or oversold conditions. When used alongside the VROC, traders can identify instances where price and volume diverge, indicating potential trend reversals or continuations.
3. Moving Average Convergence Divergence (MACD): The MACD is a versatile indicator that combines moving averages and offers insights into trend strength and momentum. By using the VROC in conjunction with the MACD, traders can identify changes in volume momentum that might support or contradict MACD signals.
Let’s say you’re using VROC to identify potential trend reversals. You notice a positive VROC crossover, indicating a bullish sentiment shift. To validate this signal, you might look at other indicators like the Moving Average Convergence Divergence (MACD) or Relative Strength Index (RSI). If both the VROC and these other indicators are confirming a bullish trend, it strengthens your confidence in the trade.
4. On-Balance Volume (OBV): OBV measures the cumulative volume flow in and out of an asset based on price movement. Combining OBV with the VROC can provide a more comprehensive picture of volume changes and trend dynamics, enhancing the ability to predict price movements.
5. Average True Range (ATR): The ATR measures market volatility and can provide context for interpreting VROC changes. Elevated ATR values combined with significant VROC spikes might indicate periods of increased volatility and potential trend shifts.
6. Bollinger Bands: Bollinger Bands indicate price volatility and can help traders identify potential breakouts. Using the VROC alongside Bollinger Bands can highlight volume surges accompanying price movements beyond the bands, signaling potential trend changes.
7. Fibonacci Retracement Levels: Combining the VROC with Fibonacci retracement levels can help traders identify potential reversals or continuations of price trends, particularly when accompanied by changes in trading volume.
8. Consider the Broader Market Context:
While VROC can provide valuable insights, it’s essential to consider the broader market context. External factors such as news events, economic data releases, or geopolitical developments can significantly impact trading volume and sentiment. Always be aware of the macroeconomic environment when interpreting VROC signals. Our clients have full access to our state-of-the-art Economic Calendar for such mandatory additional analysis.
Example: Imagine you’re trading a stock CFD, and VROC shows a significant increase in volume, indicating growing interest. However, news breaks that the company just released disappointing earnings. In this case, the negative news might outweigh the bullish VROC signal, and it’s crucial to factor in such external factors when making trading decisions.
9. Beware of False Signals, Especially in Low-Volume Periods:
VROC, like any indicator, is not infallible and can generate false signals, especially during periods of low trading volume. Low liquidity can lead to erratic price movements and less reliable VROC readings. Be cautious when interpreting VROC signals in such conditions.
Example: During a holiday or after-hours trading session, the stock market experiences extremely low trading volume. If you rely solely on VROC during these periods, you may encounter more false signals due to the lack of market participation. It’s essential to use VROC in conjunction with other indicators or exercise caution during low-liquidity times.
Application to Different Trading Approaches:
The efficiency of the VROC indicator is not confined to a single trading approach; it can be applied by traders with various strategies and timeframes. Here’s a breakdown of its application to different trading styles:
- Day Traders: Day traders can potentially benefit from VROC by using it to identify intraday shifts in trading volume and sentiment. It helps in pinpointing potential entry and exit points during a trading session, especially when combined with other intraday indicators like moving averages or RSI. For day traders, customizing VROC involves selecting shorter timeframes (e.g., 5-minute or 15-minute charts) to focus on intraday movements. Adjust the smoothing method to align with rapid price changes. Experiment with different alert settings to receive notifications when volume surges occur, enabling you to react swiftly to potential day trade opportunities.
- Swing Traders: Swing traders often use VROC to validate longer-term trend reversals or continuations. When applied on daily or weekly charts, VROC can provide valuable insights into the strength of price moves, aiding in the identification of optimal swing trade opportunities. Swing traders often use daily or weekly charts, so customize VROC accordingly. Choose a longer timeframe to capture broader market trends. Consider using a longer smoothing period to filter out short-term noise. Setting alerts for significant VROC crossovers on these timeframes can help identify potential swing trade entry and exit points.
- Trend Followers: Traders who follow trends can utilize VROC to gauge the potential sustainability of trends. When VROC aligns with the direction of the trend, it suggests that the prevailing momentum is supported by increasing volume, reinforcing the trend-following strategy. Trend followers benefit from VROC when it aligns with the dominant trend. Use longer timeframes (daily or weekly) and select a smoothing method that emphasizes smoother, more sustained trends. Configure alerts for crossovers in the direction of the trend to confirm momentum. This can guide trend followers in staying with profitable trends and exiting positions when the trend weakens.
- Scalpers: Scalpers, who focus on short-term price movements, may employ VROC on very short timeframes (e.g., one-minute or five-minute charts) to potentially capture quick price fluctuations driven by volume spikes. It helps in identifying potential scalping opportunities, especially when used in conjunction with other intraday indicators. Scalpers should focus on very short timeframes, such as one-minute or five-minute charts. Customize VROC to these fast-paced conditions by using a shorter smoothing period to capture rapid changes in volume. Configure alerts for sharp VROC spikes that coincide with potential scalping opportunities. A heightened focus on real-time volume changes is crucial for scalpers.
The VROC indicator stands as a powerful tool in a trader’s arsenal, providing crucial insights into volume trends and potential market reversals. By incorporating this indicator into your trading strategy, you can gain a competitive edge in the dynamic world of financial markets. As you implement these strategies, it’s important to choose a reliable trading platform. Eightcap offers a seamless trading experience on TradingView, ensuring you have access to a wide range of tools and resources to make informed decisions. With your Eightcap Trading Account, you can execute your trading strategies with confidence, backed by a trusted platform. Embrace the power of the VROC indicator and elevate your trading endeavors to new heights.
* The information provided here has been prepared by Eightcap’s team of analysts. All expressions of opinion are subject to change without notice. Any opinions made may be personal to the author and do not reflect the opinions of Eightcap.
In addition to the disclaimer on our website, the material on this page does not contain a record of our trading prices, or represent an offer or solicitation for a transaction in any financial instrument. Eightcap accepts no responsibility for any use that may be made of these comments and for any consequences that result. No representation or warranty is given as to the accuracy or completeness of this information. Consequently, any person acting on it does so entirely at their own risk. Any research provided does not have regard to the specific investment objectives, financial situation and needs of any specific person who may receive it. It has not been prepared in accordance with legal requirements designed to promote the independence of investment research and as such is considered to be a marketing communication.
Please note that past performance is not a guarantee or prediction of future performance. This communication must not be reproduced or further distributed without prior permission.