

19 October 2026

Alexander Chieffalo
In this article
This edition of Market Minute explores the impact of a deepening AI selloff and surging crude oil prices, followed by the weekly calendar and technical analysis of twelve key global markets.
Market overview
The AI selloff deepened last week and moved beyond shares. The Nasdaq 100 fell 5.5%, bonds financing some of the largest US data centres slipped well below face value, and companies planning to list are meeting pushback on their valuations. More than 70 S&P 500 companies report this week, including Meta and Tesla, putting the AI trade back on trial.
Inflation ran hot, yet bonds rallied. Investors moved into Treasuries as stocks slid, pulling the 10 year yield down about 17 basis points, and markets pulled back from pricing an October hike. The Fed is now in its blackout period ahead of its 28 October decision.
Oil added to the pressure. WTI climbed about 15% in seven sessions to near $100 and Brent topped $110 for the first time since May, as attacks spread to Saudi export routes and Gulf shipping. Russia and Ukraine also resumed strikes on each other's energy sites despite the ceasefire Washington announced, keeping fuel prices, and the inflation they feed, on the rise.
Outside the US, the picture is mixed. In Europe, riots in France have pushed the country's borrowing costs to their highest premium over Germany since the debt crisis, and with Spain heading to a snap election, the euro has become a political trade. Britain is moving the other way: sterling hit a monthly high on a hawkish Bank of England, and jobs, inflation and retail sales all land this week. In Asia, Beijing stepped in to support its stock market after a tech slump, making Monday's growth figures the first test of whether policy support is enough. And in Canada, higher oil and a central bank that says it is falling behind on inflation have finally given the loonie some footing ahead of Monday's CPI.
Week Ahead Calendar
Dates shown in UTC. Markets to watch are listed in parentheses.
Monday 19 October
- China Q3 GDP, industrial production and retail sales (HK50, Copper, ASX200)
- Canadian CPI (USD/CAD)
Tuesday 20 October
- UK jobs and unemployment (GBP/USD)
Wednesday 21 October
- UK CPI (GBP/USD)
- ECB President Lagarde speech (EUR/USD)
- US 20 year Treasury auction (USDX)
Thursday 22 October
- US initial jobless claims (USDX)
Friday 23 October
- UK retail sales (GBP/USD)
- Eurozone, UK and US flash PMIs (EUR/USD, GBP/USD, USDX)
- University of Michigan consumer sentiment (USDX, XAU/USD)

US Dollar Index (USDX)
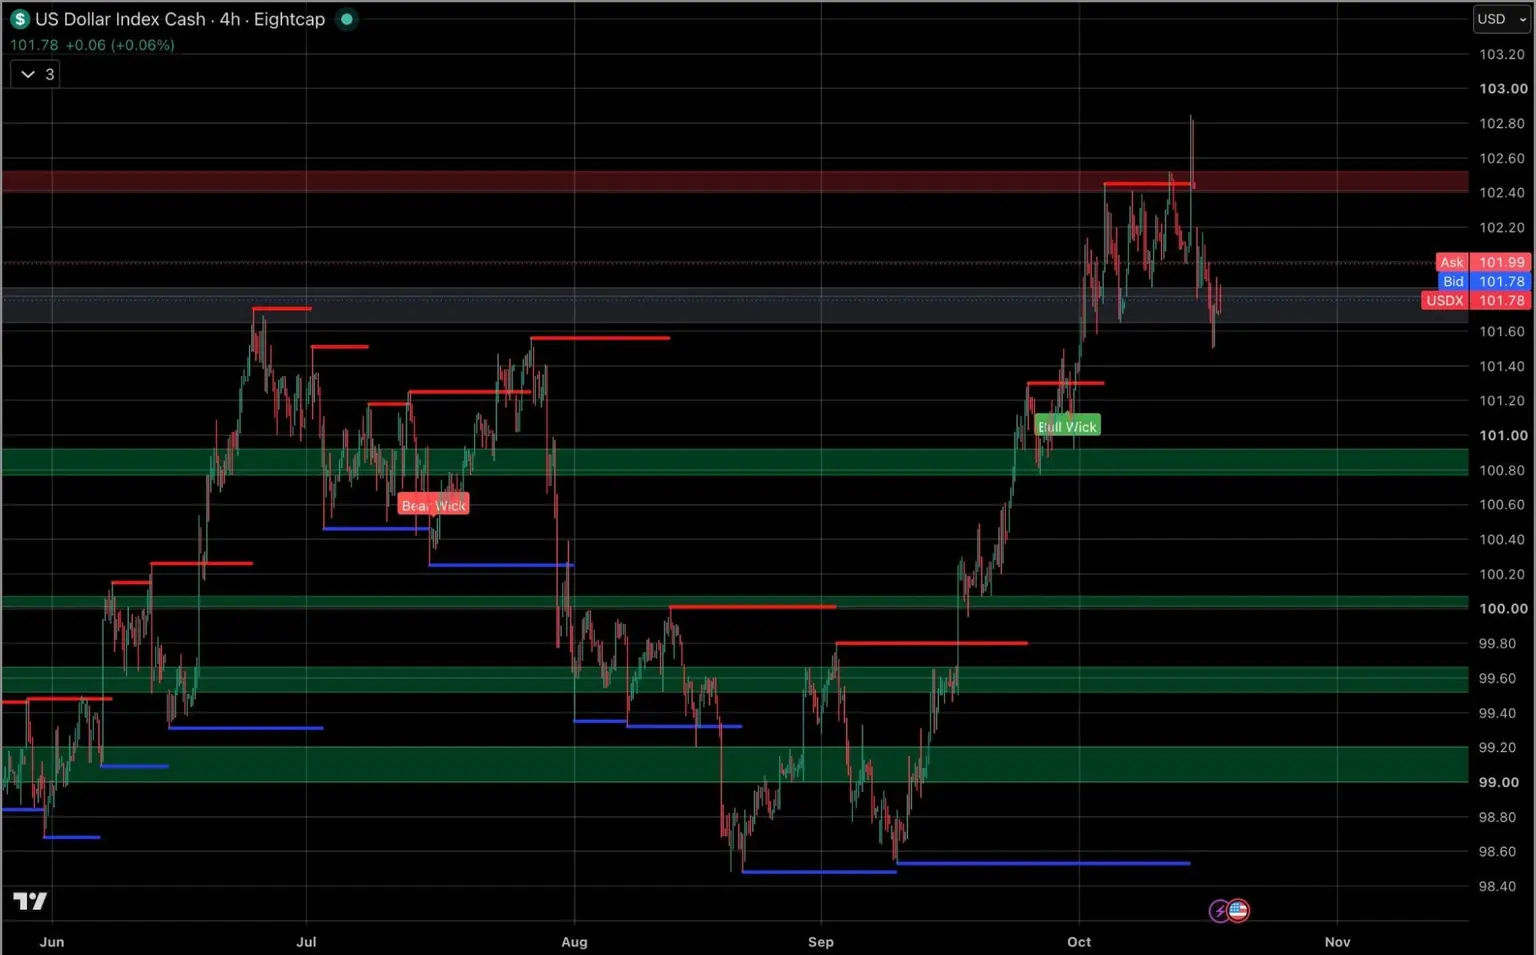
The US Dollar Index trades at 101.78, back at the bottom of its October range after a brief spike to 102.85 faded. The data was strong: September CPI rose 3.7% from a year earlier against 3.6% expected, producer prices jumped 6.3%, and retail sales and industrial production both beat forecasts. Markets briefly priced close to even odds of an October hike, but Fed Chair Kevin Warsh said he does not prejudge meetings, and current pricing puts a hold at about 84%.
What capped the dollar was the bond rally. Treasuries acted as a haven for the first time in months, and the last time 10 year yields and the Nasdaq fell this much in the same week was the April 2025 tariff turmoil. State Street's Masahiko Loo says that in a bigger AI-driven selloff, Treasuries "increasingly appear capable of providing the hedge investors have been missing." With the Fed in its blackout period, flash PMIs and jobless claims carry the week.
Price Levels
- Support: 101.66 → 101.30 → 100.75
- Resistance: 102.20 → 102.46 → 102.85
Technical View: The index has ranged between roughly 101.66 and 102.46 since early October, and last week's spike to 102.85 was rejected. A break of the range floor exposes the 100.80 to 101.00 zone where the September rally paused.
Outlook: Rangebound. Hot inflation and falling yields are pulling the dollar in opposite directions, and with the Fed silent, the data has to break the tie.
Nasdaq 100 (NDX100)
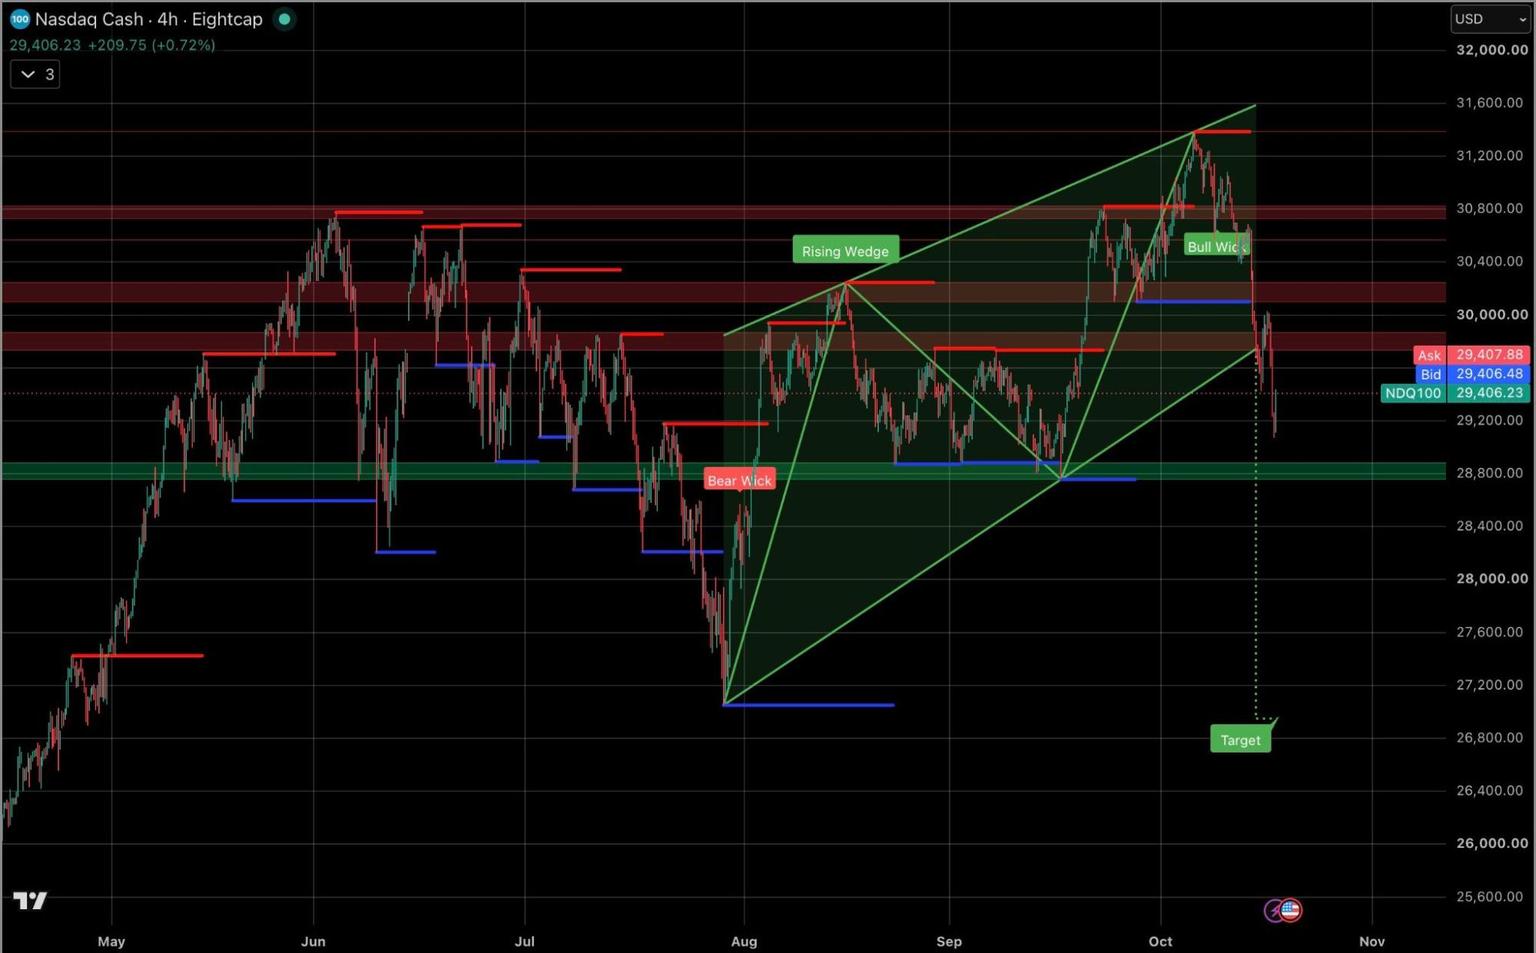
The Nasdaq 100 trades at 29,406, with the VIX at a four-month high and the S&P 500 posting its worst week since June. CoreWeave lost about a quarter of its value, Nvidia shed roughly $270bn in market value, and AI cloud developer Nscale is facing investor pushback on its IPO, with some buyers suggesting $16bn to $19bn against the roughly $30bn it is seeking. Microsoft also pulled out of a UK data centre deal with the company.
The concern is financing. Higher rates raise the cost of debt-funded build-outs just as signs of slowing revenue growth at leading AI developers, a delayed OpenAI listing and local opposition to new data centres raise doubts about the payoff. WSJ's James Mackintosh notes that Nvidia's valuation has fallen from 23 to 15 times forecast earnings even as profits surged, because investors doubt those profits will last. Meta and Tesla report this week.
Price Levels
- Support: 29,235 → 28,900 → 28,200
- Resistance: 29,750 → 30,085 → 30,840
Technical View: Price has broken below the rising wedge from the late July low, with a measured target near 26,900, after last week's consolidation gave way. The 28,800 to 28,900 zone, the floor of the August to September range, is the first real support.
Outlook: Bearish bias. The AI debate has moved from valuations to financing, and this week's earnings need to restore confidence before buyers return.
Gold (XAU/USD)
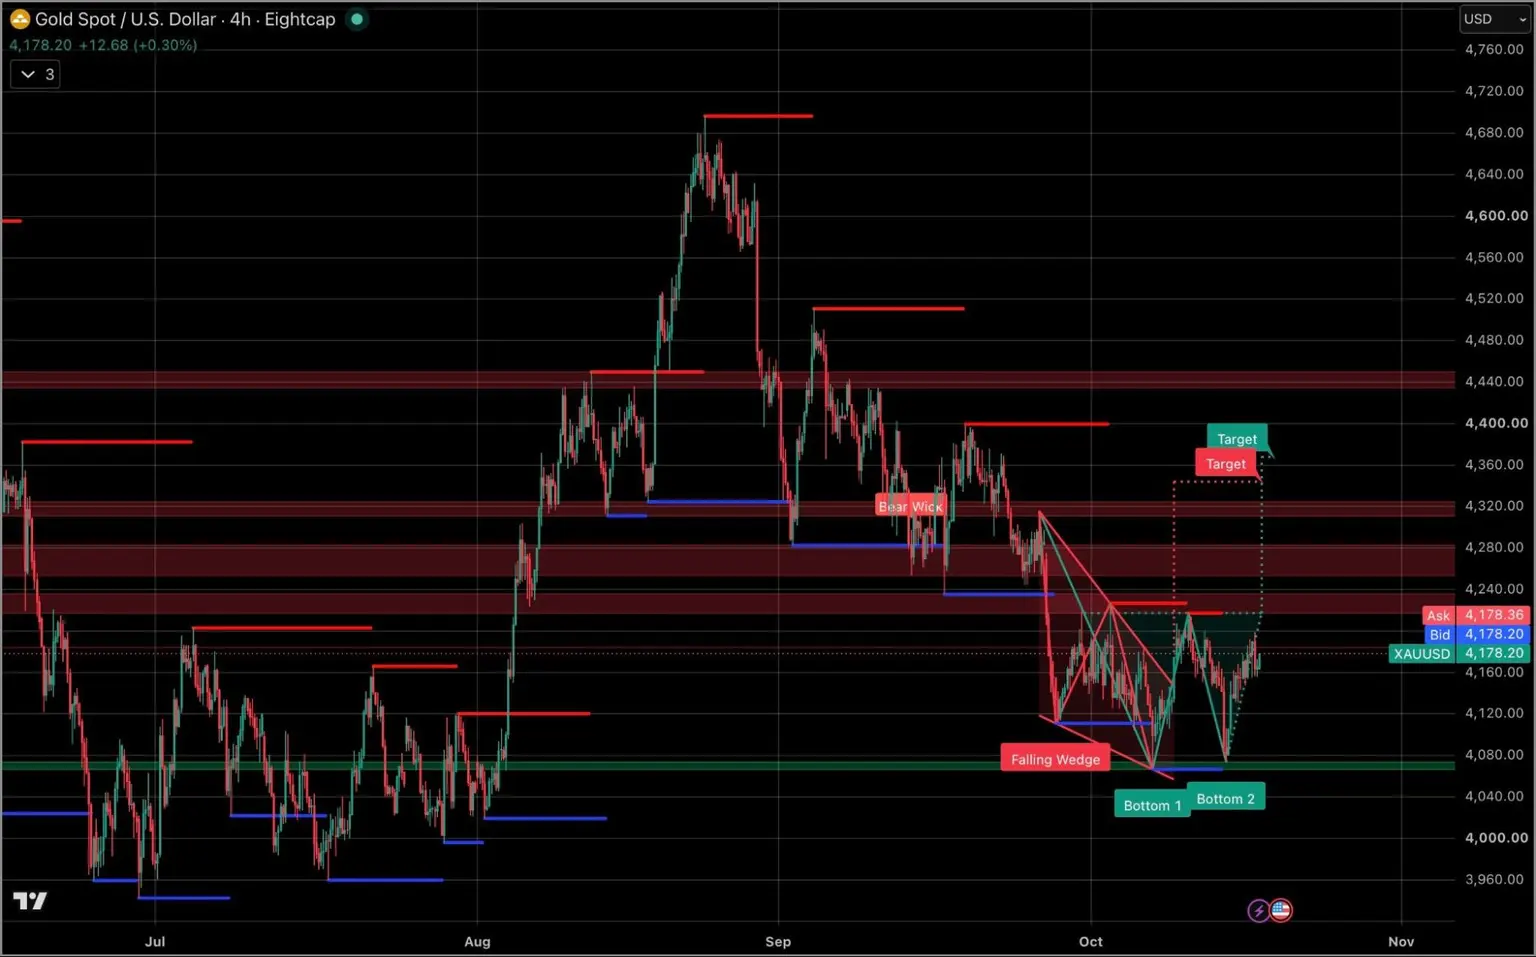
XAU/USD trades at 4,178, still boxed between 4,100 and 4,200. Hot inflation should have lifted it, but the 10 year yield near 5.1% keeps the cost of holding a non-yielding asset high.
Gold has now held the 4,070 area twice this month, and the backdrop is slowly turning in its favour. Yields have eased from their highs, energy is pushing inflation higher, and geopolitical risk is spreading from the Gulf to Ukraine. Friday's consumer sentiment and inflation expectations are the week's main US read.
Price Levels
- Support: 4,110 → 4,070 → 4,025
- Resistance: 4,225 → 4,280 → 4,325
Technical View: A double bottom near 4,070 has formed inside a falling wedge that already broke higher, with a neckline near 4,215 and targets around 4,350. Overhead supply between 4,240 and 4,320 is the main obstacle.
Outlook: Bullish bias. Easing yields and broadening geopolitical risk favour gold, though it needs to clear 4,200 before the recovery gains momentum.
Silver (XAG/USD)
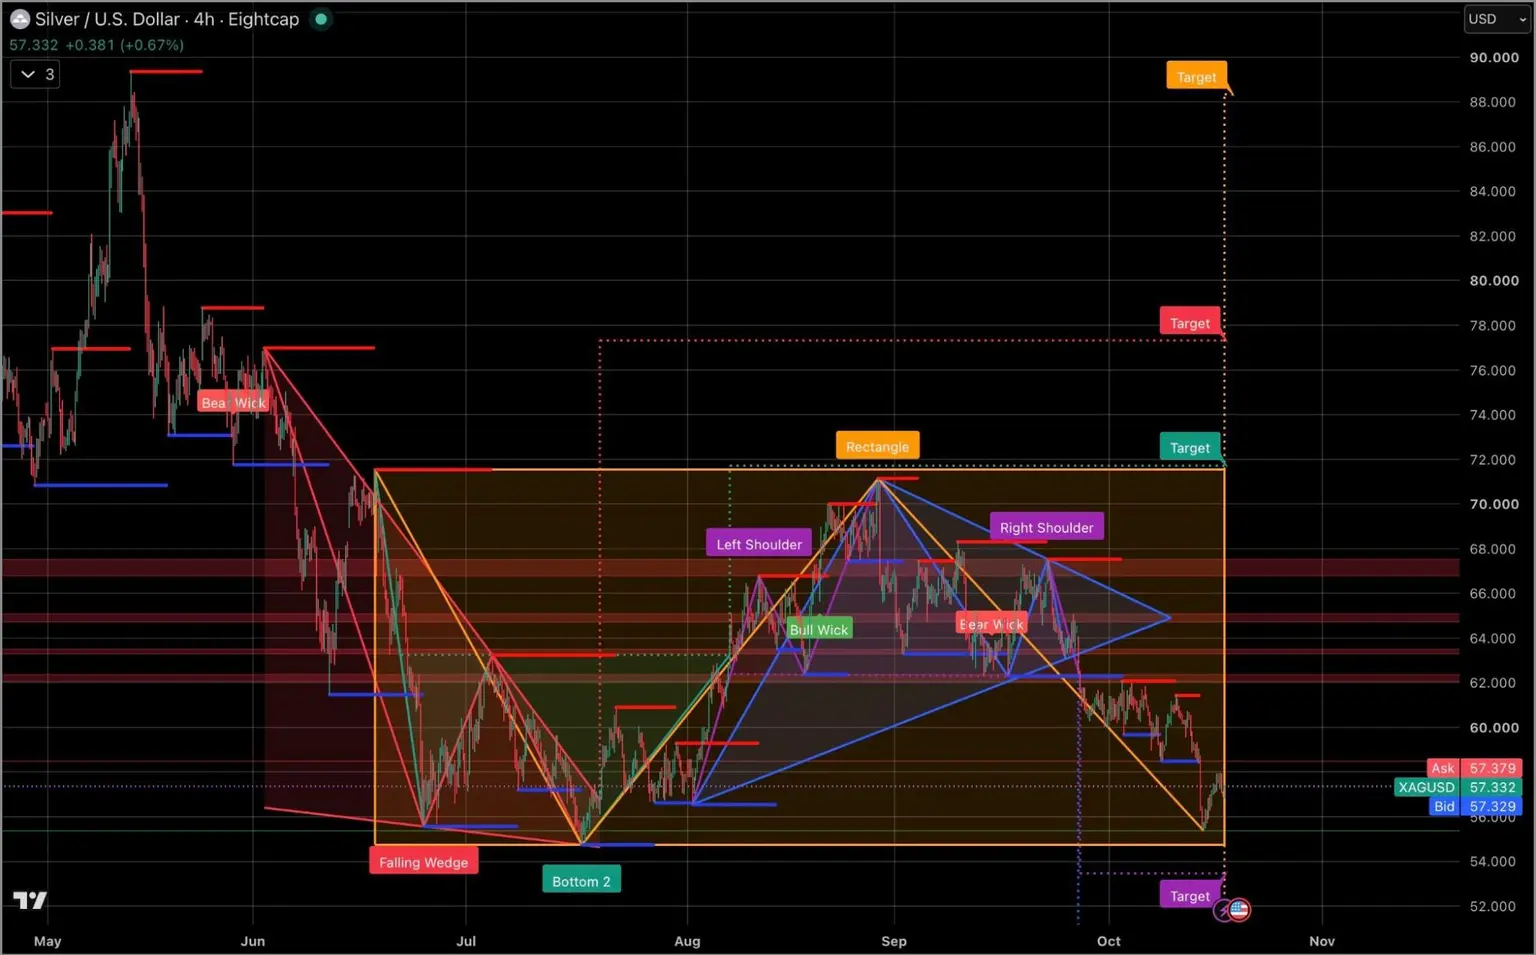
Silver trades at 57.33 after breaking below 60 last week and touching 55.38, close to its year-to-date low of 54.77. It has fallen far harder than gold, because more than half its demand comes from industry and growth worries are mounting.
China's GDP on Monday is the first read on industrial demand this week. A strong print would help, but silver has yet to show the haven buying that has steadied gold.
Price Levels
- Support: 56.55 → 55.66 → 54.75
- Resistance: 57.85 → 58.52 → 60.00
Technical View: The August to September head and shoulders top has broken lower, with a measured target near 53.50. Price now sits just above the floor of a rectangle that has held since June near 54.80.
Outlook: Bearish bias. Weak industrial sentiment and a confirmed top keep sellers in control, though the summer lows have held before.
WTI (USO/USD)
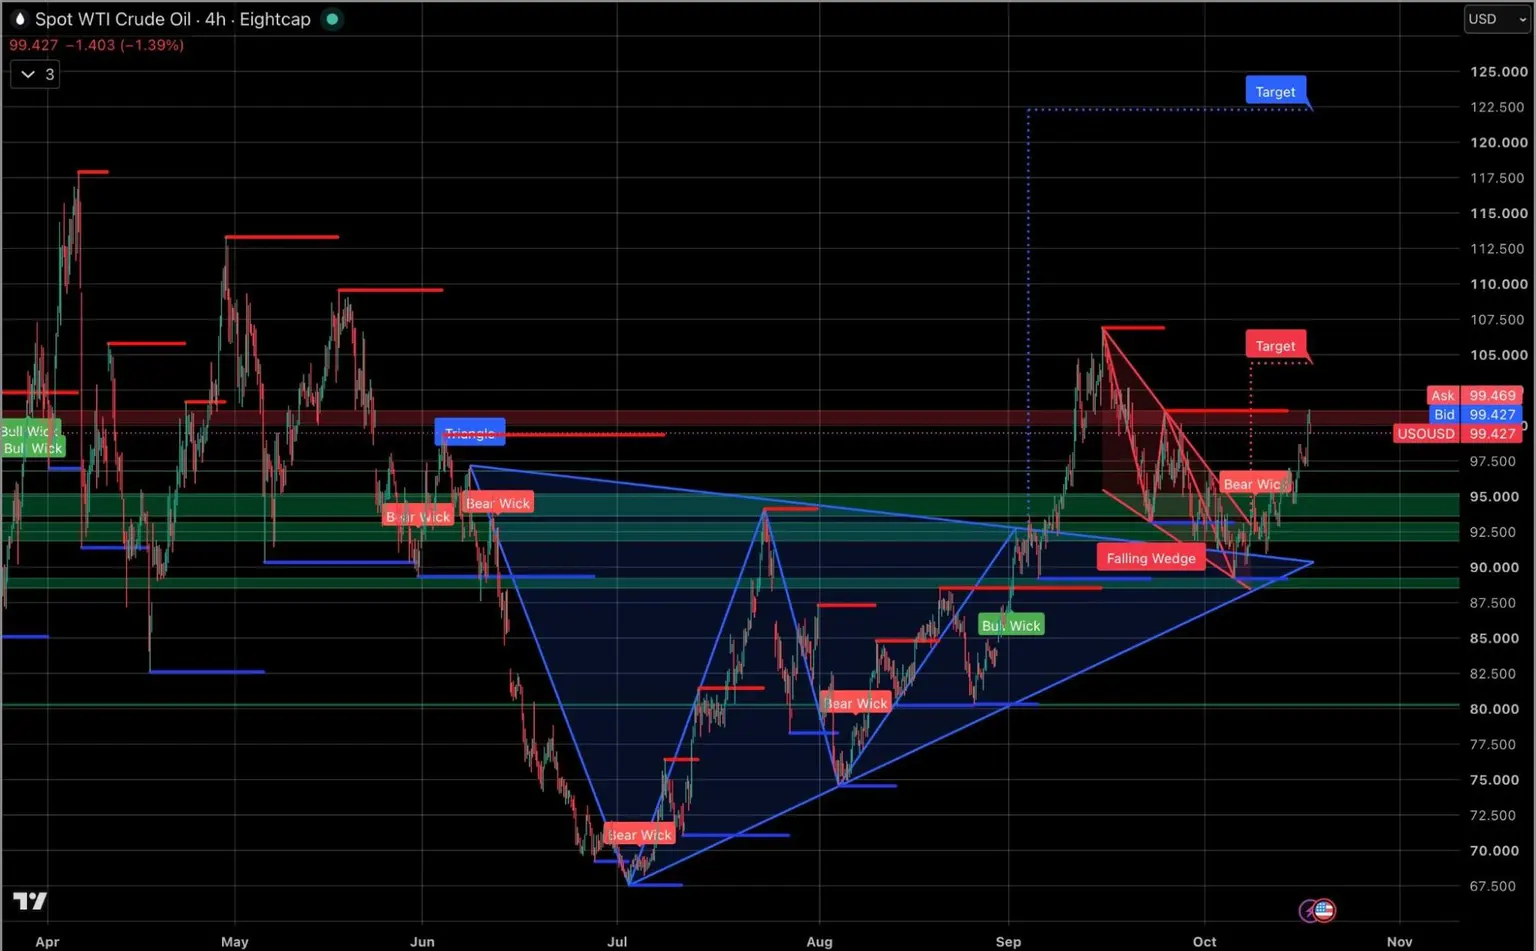
WTI trades at 99.47, with Brent up about 80% this year. The Houthis targeted Yanbu, a key Saudi export hub on the Red Sea, a Saudi helicopter crashed near the Yemeni border, and two tankers were reported hit in the Gulf. On Friday, oil's jump dragged Treasuries and stocks lower together, a reminder that energy can still break the bond market's new role as a haven.
The diesel deal with Russia is unravelling politically. Washington waived part of a new Russia sanctions law to keep it alive, US lawmakers introduced a bill to block it, and Kyiv has accused the US of pressuring it to stop striking Russian refineries. European diesel futures have more than doubled this year. On the other side, the US says it escorted more than 100 million barrels through Hormuz in recent days.
Price Levels
- Support: 95.20 → 93.15 → 89.30
- Resistance: 101.00 → 106.95 → 109.60
Technical View: The falling wedge from the September high has broken higher and is closing on its measured target near 104.50, while the larger triangle from June points much higher. The 100 to 101 zone is the first test.
Outlook: Bullish but stretched. Attacks on export routes keep the risk premium rising, but a 15% run in a week leaves room for a pullback on any sign of de-escalation.
Bitcoin (BTC/USD)
GBP/USD trades at 1.3328 after rebounding from its year-to-date low near 1.3135 last week. A more hawkish tone from the Bank of England and stronger UK growth data did the work, helped by a dollar that fell to its lowest since 6 October.
This is the UK's biggest data week in months. Unemployment is expected to tick up to 5.0% on Tuesday, inflation to rise to 3.4% from 3.1% on Wednesday, and retail sales to fall 0.2% on Friday. A hot inflation print would back the BoE's tone, while a jump in unemployment would test it.
Price Levels
- Support: 1.3312 → 1.3279 → 1.3200
- Resistance: 1.3343 → 1.3370 → 1.3463
Technical View: The pair has broken above the 1.3280 to 1.3300 ceiling that capped it through October, ending a month-long base on the 1.3180 to 1.3200 zone. The next resistance band sits near 1.3465, where the September breakdown began.
Outlook: Bullish bias. A hawkish central bank and a softer dollar favour sterling, though a weak jobs report on Tuesday could cut the move short.
Euro (EUR/USD)
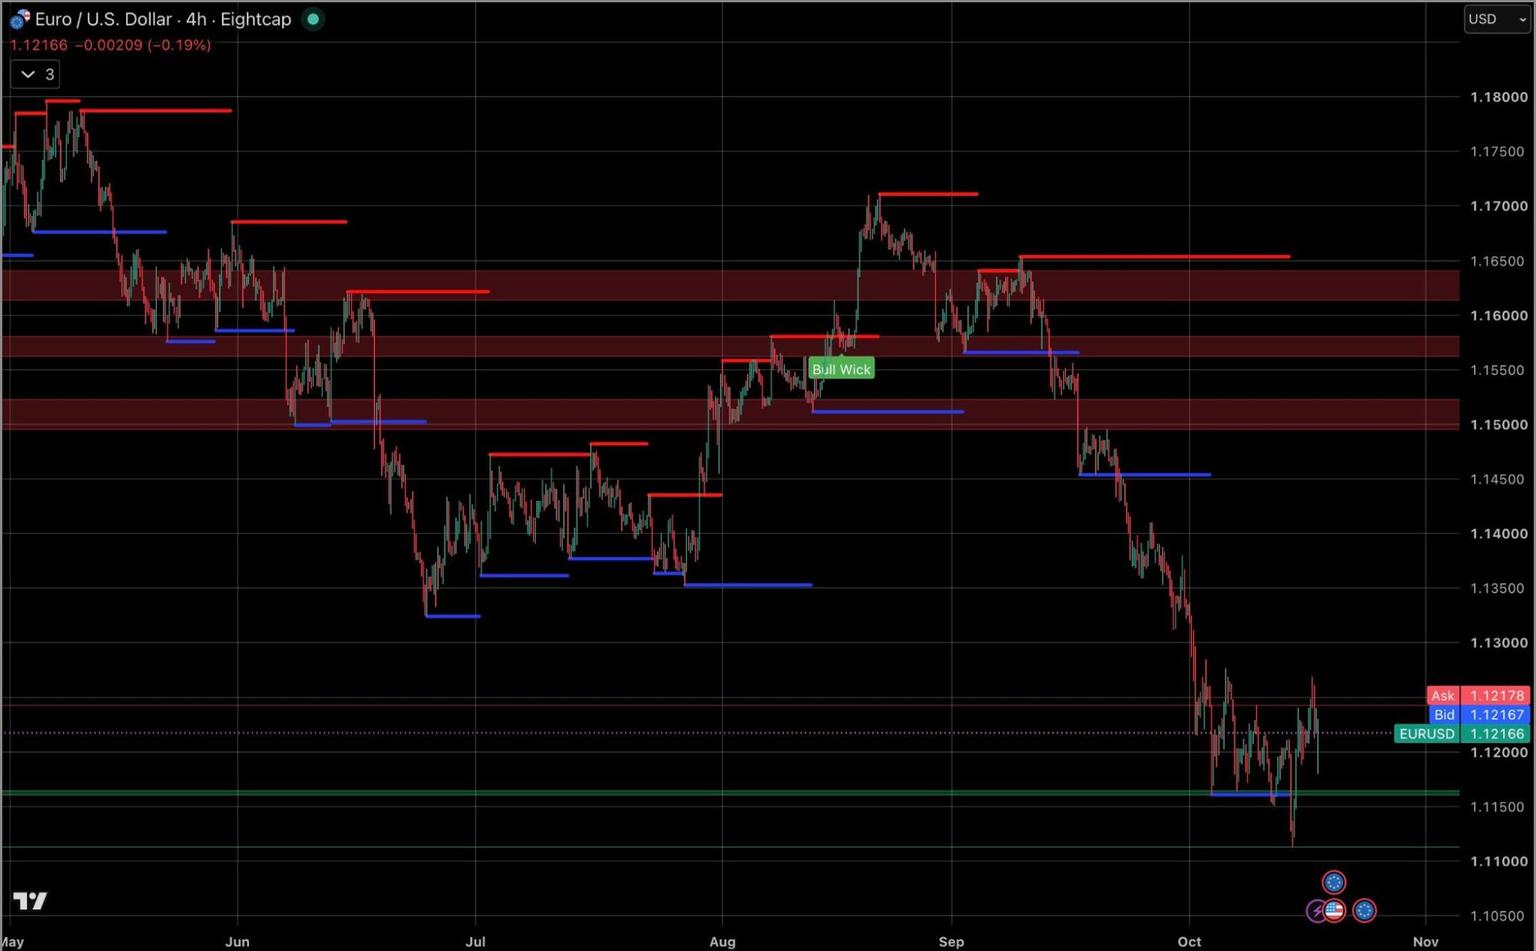
EUR/USD trades at 1.1217, lagging other majors after protests in France turned into some of the country's worst street violence in years, with looting and landmarks set on fire. The French premium over German 10 year debt has pushed beyond 150 basis points, the widest since 2011, and Spain heads to a snap election on 29 November.
The ECB has made clear that France must fix its finances through its own fiscal policy, leaving the problem with Paris. Further ECB hikes are still expected into early next year, which would normally support the euro. Lagarde speaks on Wednesday, and Friday's flash PMIs will show whether the unrest is reaching business activity.
Price Levels
- Support: 1.1161 → 1.1113 → 1.1062
- Resistance: 1.1244 → 1.1300 → 1.1320
Technical View: The pair has moved sideways between about 1.1160 and 1.1280 since early October after a steep September decline. A spike to 1.1115 last week was quickly bought, but each rebound has stalled below 1.1280.
Outlook: Bearish. Political risk in France and Spain is now driving the euro more than rates, and neither looks close to resolution.
AUD/USDCanadian Dollar (USD/CAD)
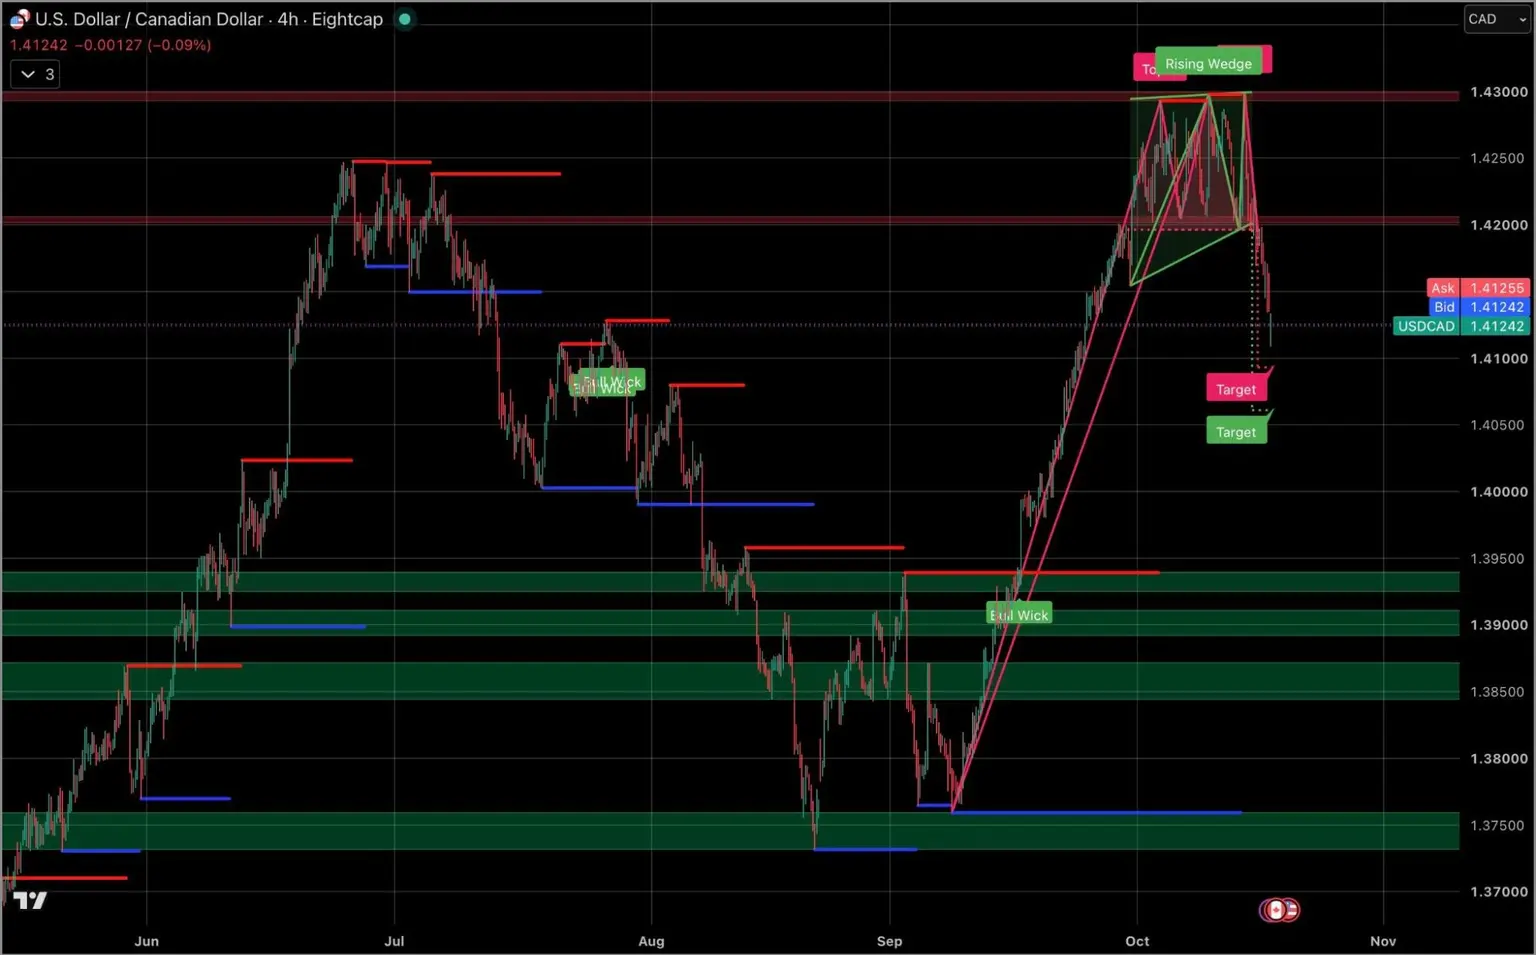
USD/CAD trades at 1.4124 after breaking below 1.42 last week, ending its run at the 1.43 ceiling. Higher oil is finally helping the loonie, and the Bank of Canada has acknowledged it is lagging other central banks in the global tightening cycle, a gap that becomes harder to close the longer it lasts.
Monday's CPI, against a prior reading of 3.0%, tests whether the Bank of Canada moves sooner. Canadian markets already price several hikes, and a hot print would add to them just as US yields fall.
Price Levels
- Support: 1.4111 → 1.4000 → 1.3941
- Resistance: 1.4152 → 1.4200 → 1.4238
Technical View: A rising wedge and triple top at 1.43 have broken lower, with measured targets between 1.4060 and 1.4090. The 1.42 level, the old range floor, is now resistance.
Outlook: Bearish bias. Oil, a hawkish Bank of Canada and softer US yields have turned in the loonie's favour after a month of dollar strength.
Hang Seng
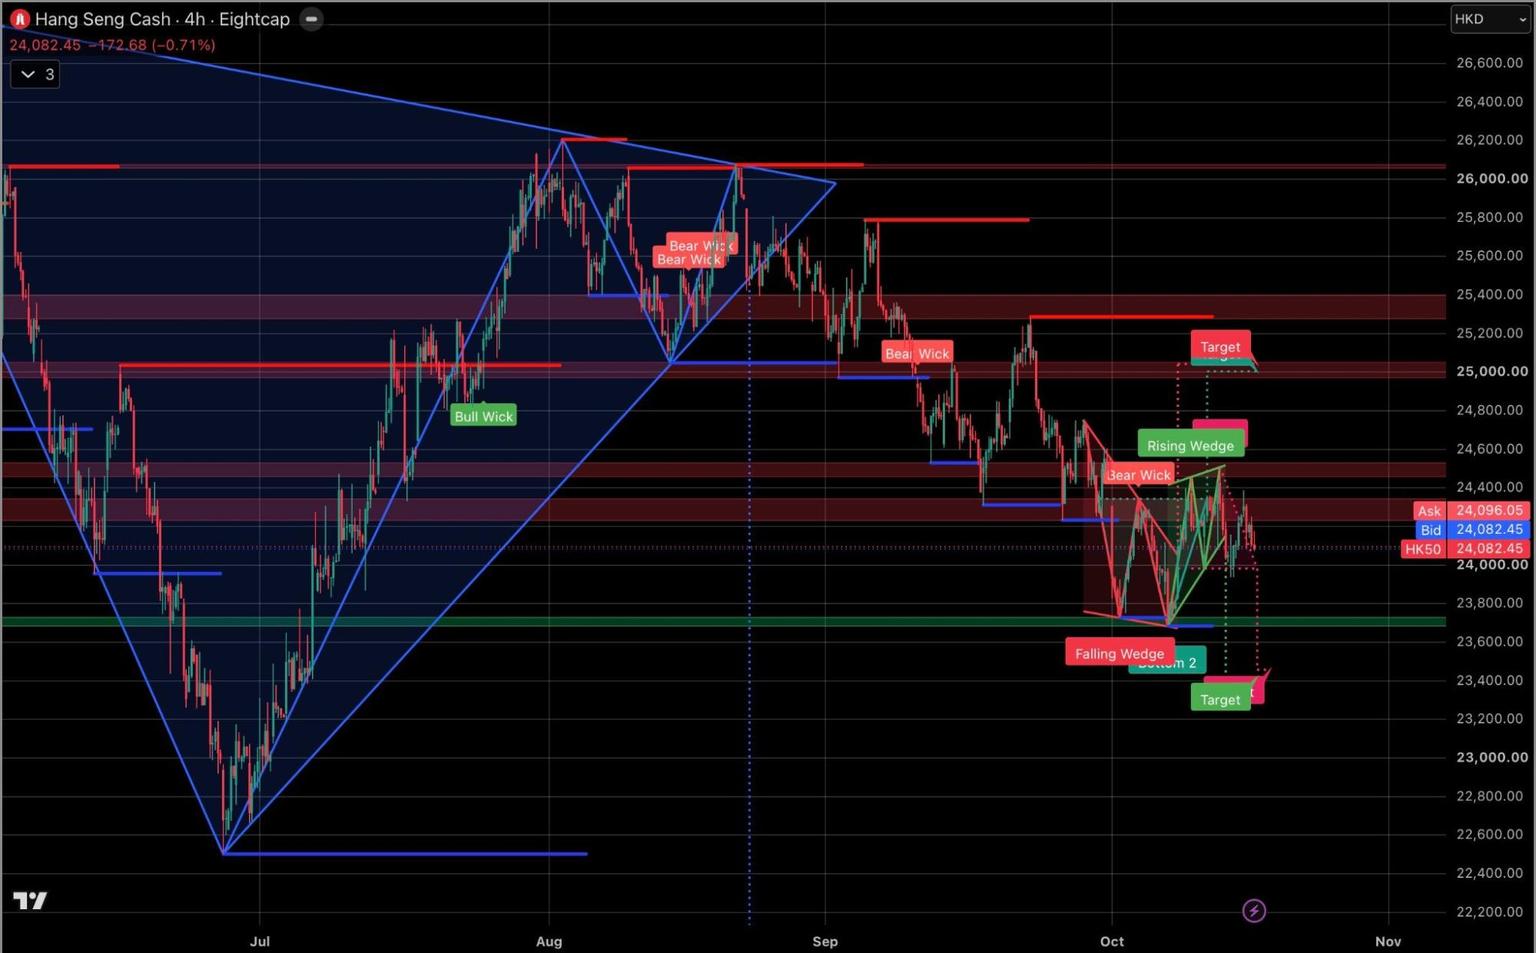
The Hang Seng trades at 24,082 after mainland tech stocks slumped last week, sending the CSI 300 to its lowest since August 2025. Beijing responded by urging companies and state funds to buy shares and guiding some investors to curb selling.
Monday brings third quarter GDP, expected at 4.4% from 4.3%, alongside industrial production and retail sales, while PBoC Governor Pan Gongsheng speaks at the Financial Street Forum. Interest rate swaps at their lowest since April 2020 show markets expect more easing, with strong exports and weak domestic demand still the pattern.
Price Levels
Support: 23,990 → 23,710 → 22,500
Resistance: 24,350 → 24,530 → 25,000
Technical View: Last week's rising wedge broke lower, undoing the bullish setup from the double bottom near 23,700. That floor now carries the base, with downside targets near 23,400 if it fails.
Outlook: Cautious. State support and easing hopes offer a floor, but the AI selloff and weak domestic demand cap the upside until Monday's data says otherwise.
Copper (XCUUSD)
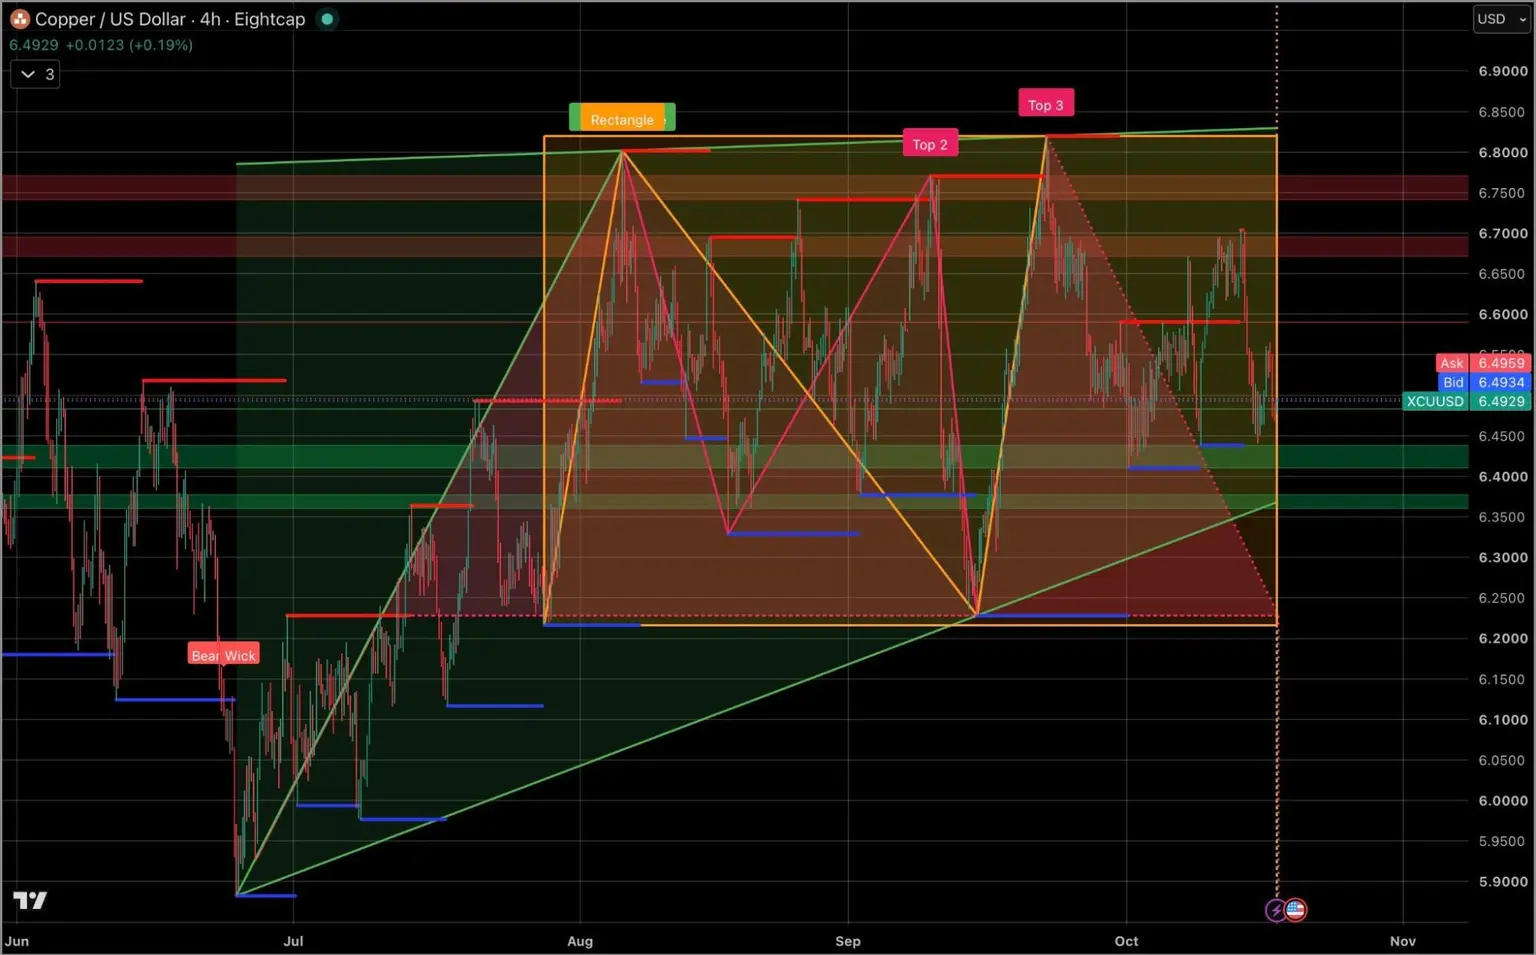
Copper trades at 6.49, in the middle of the range it has held since August. Physical demand in China has been the support, with Shanghai inventories at their lowest since December 2023 as fabricators restocked ahead of the National Day holiday.
Investors are less convinced. Speculative bullish positions have fallen for six straight weeks even as prices rose, which suggests the gains rest on physical buying rather than conviction. China's reopening on Thursday shows whether that restocking continues once the holiday ends.
Price Levels
- Support: 6.4495 → 6.3800 → 6.2312
- Resistance: 6.5223 → 6.6426 → 6.7742
Technical View: Copper has traded in a rectangle between about 6.22 and 6.82 since August, with three failed tests of the top. A break below 6.22 would target 5.60.
Outlook: Rangebound. The triple top caps the upside near 6.80, while 6.2312 is the line that turns the range into a breakdown.

Copper
Copper trades at 6.49, in the middle of a range it has held since late July, as traders reassess the tariff bet that drove prices to records. London prices hit a record near $15,000 a ton last month, but the premium New York futures held over London has collapsed as doubts grow over whether US tariffs will arrive.
LME Week in London puts that debate front and centre, with analysts' scenarios ranging from $10,000 to $18,000 a ton depending on what Washington does. The Commerce Department has recommended phased tariffs of 15% in 2027 and 30% in 2028, while shipments to the US from Africa are already slowing. Financing deals on the vast US stockpile could keep metal from flowing back out even without tariffs, and El Niño threatens to keep African Copperbelt output flat into 2027.
Price Levels
- Support: 6.4360 → 6.4110 → 6.3800
- Resistance: 6.5933 → 6.7000 → 6.7440
Technical View: The rectangle between about 6.22 and 6.82 remains intact, with three failed tests of the top and lower highs since late September. The 6.41 to 6.44 zone is the first support.
Outlook: Rangebound. Tight supply and stockpile financing support prices, but fading tariff bets remove the force that drove the rally.
ASX200
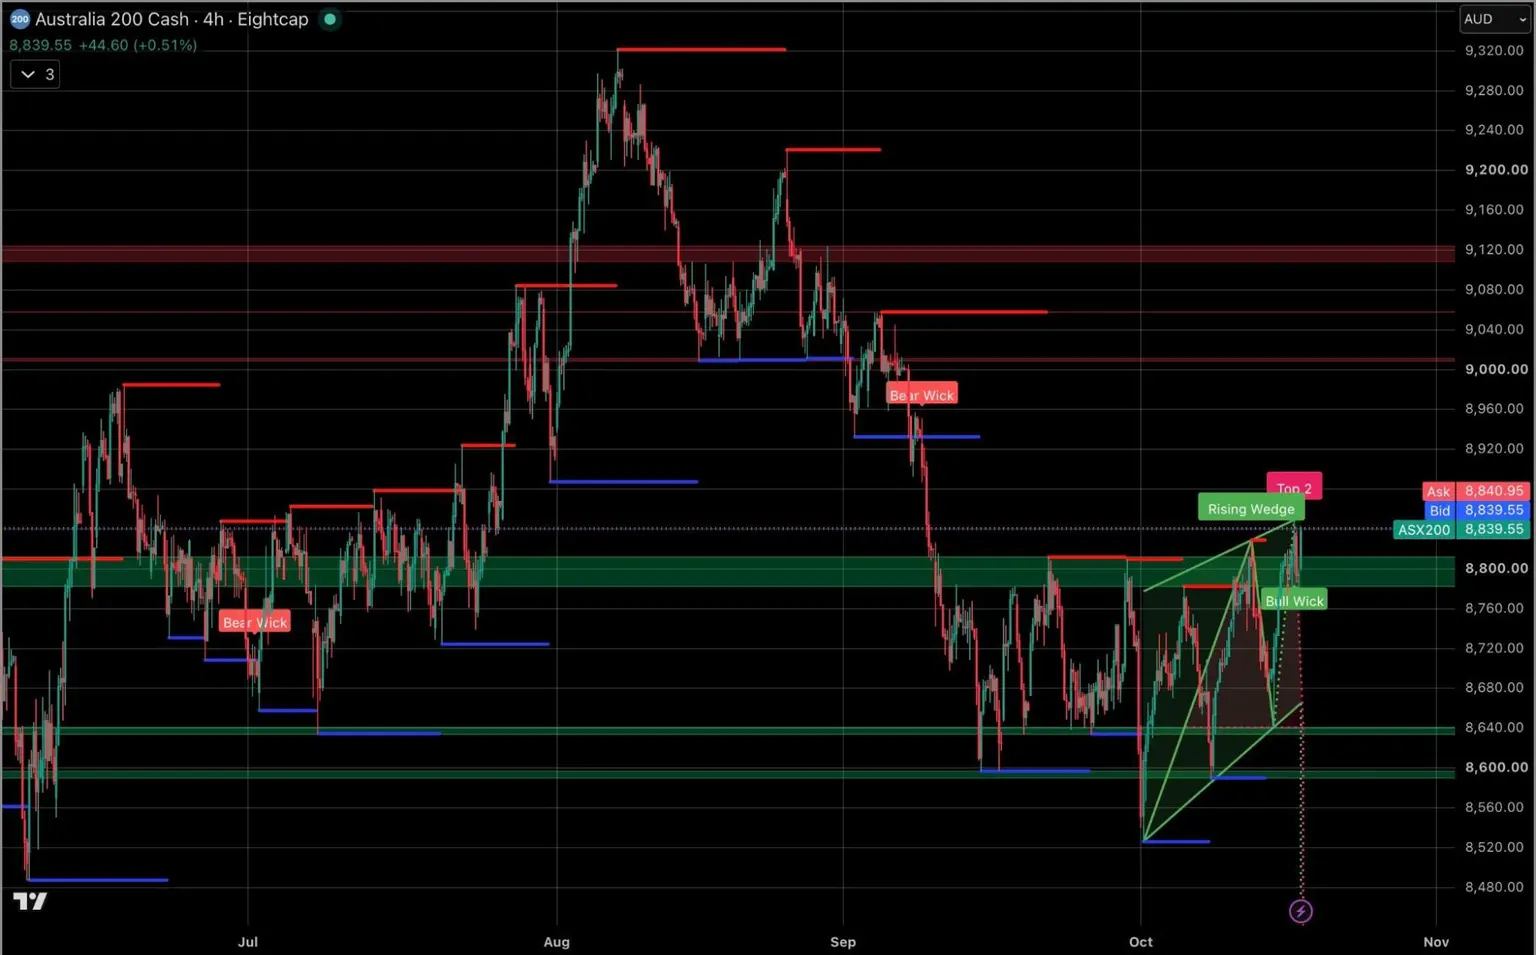
The ASX 200 trades at 8,840, recovering from its October low near 8,520 even as the AI selloff hit global markets. Australia's 10 year yield sits at 5.24%, and the collapse of Australian data centre company Firmus's IPO plan shows local exposure to the same financing concerns hitting the US.
China is the key outside driver for miners this week, with GDP on Monday and policy signals from Beijing. The Australian dollar has firmed toward 0.6970 as the US dollar softened.
Price Levels
- Support: 8,783 → 8,725 → 8,640
- Resistance: 8,885 → 8,920 → 9,000
Technical View: The October recovery has formed a rising wedge, and price is testing its upper line near 8,840 with a potential double top. A break of the wedge's lower line near 8,640 would target the October low.
Outlook: Cautious. Chinese support helps miners, but higher local yields and AI risk leave the rebound vulnerable.
Video transcript
The AI selloff spread last week. The Nasdaq one hundred fell five and a half percent, and the pain reached bonds tied to data centres. Chip stocks fell nine days straight, their longest run since two thousand and six. Goldman Sachs says investors demanded record extra yield on risky AI bonds.
Inflation came in hot, but bonds rallied anyway as investors looked for safety.
Oil is the other pressure point. Brent hit nearly one hundred and ten dollars, after attacks on Saudi export routes and tankers in the Gulf.
In Europe, riots in France pushed the euro lower as debt fears grow. French ten-year yields hit their highest in twenty-four years this month, and the government still needs to pass fifty-four billion euros in budget savings. Sterling, meanwhile, hit a monthly high.
This week, China’s growth figures and Canadian inflation land Monday. UK jobs follow Tuesday and UK inflation Wednesday. Meta and Tesla report, and flash PMIs close the week. The Fed is in its quiet period ahead of next week’s decision, so no officials will speak this week. Trade carefully.

Trade the Week Ahead
Explore our AI-powered Economic Calendar to stay ahead of market events.

Alexander Chieffalo | Eightcap Risk Manager
Alexander Chieffalo is Risk Manager at Eightcap.
Related articles

Trade gold CFDs 24/7 with GOLD247
Trade GOLD247, Eightcap's Gold/USD CFD, seven days a week.
17 August 2026

How does forex trading work?
New to forex? Learn how forex trading works in plain English, including currency pairs, price movements, CFDs, leverage and how to practise first.
17 August 2026

The six factors that drive Gold prices
What drives the price of Gold? Gold is considered to be a safe haven asset during periods of market volatility.
27 February 2020


