
Trading WTI and Brent Oil CFDs in volatile times

Trading in the energy markets, specifically West Texas Intermediate (WTI) and Brent Oil, can be both potentially rewarding and challenging. These markets are known for their volatility, with prices often subject to sudden and dramatic fluctuations. For traders looking to profit from this volatility, Contracts for Difference (CFDs) offer a flexible and leveraged instrument to access these markets. In this article, we will explore the strategies and considerations for trading WTI and Brent Oil during volatility.
Understanding WTI and Brent Oil
Before delving into trading strategies, it’s essential to understand the differences between WTI and Brent Oil. Let me remind you of the specifics between the two markets below:
West Texas Intermediate (WTI):
- Composition and Source:
- Light Sweet Crude: WTI is often referred to as “Texas Light Sweet” due to its low sulfur content and light density. This makes it relatively easy to refine into high-value products like gasoline and diesel.
- Produced in the U.S.: WTI is primarily extracted from fields in the United States, primarily in Texas, Louisiana, and North Dakota. It’s sourced from various shale formations and conventional oil fields.
- Benchmark Status:
- North American Benchmark: WTI serves as a benchmark for crude oil prices in North America. Its pricing is used as a reference point for traders, producers, and refiners in the region.
- Cushing, Oklahoma Delivery Point: WTI prices are determined at the storage hub in Cushing, Oklahoma. This makes it a critical location for pricing and delivery logistics.
- Volatility and Price Sensitivity:
- Sensitivity to U.S. Events: WTI prices can be particularly responsive to events and news within the United States, such as inventory reports, production data, and economic indicators.
- Supply Chain Impact: Disruptions in the U.S. supply chain, such as hurricanes affecting production or pipeline issues, can lead to sudden price fluctuations.
Brent Crude:
- Composition and Source:
- North Sea Production: Brent Oil is extracted from various oil fields in the North Sea, located between the United Kingdom and Norway. It’s known for its light, low-sulfur composition.
- Global Accessibility: Brent is produced in a region with well-established infrastructure, allowing for efficient extraction and transportation.
- Benchmark Status:
- Global Benchmark: Brent Crude is considered a global benchmark for crude oil prices. Its pricing influences trading decisions and contracts worldwide.
- Diverse Applications: It’s a critical component in the production of gasoline and other refined products. It is also used as a reference for pricing in international markets.
- Volatility and Price Sensitivity:
- Global Impact: Being a global benchmark, Brent Oil prices can be influenced by a wide range of global events, including geopolitical uncertainty and major economic shifts.
- Supply Chain and Geopolitical Risks: Disruptions in North Sea production, geopolitical factors, and transportation constraints can lead to rapid and significant price movements.
Key Takeaways:
- Price Differential: WTI and Brent prices can diverge due to various factors, including transportation costs, quality differentials, and regional supply and demand dynamics.
- Global Interconnectedness: While WTI is a North American benchmark and Brent is a global benchmark, events in one region can influence prices in the other due to the interconnectedness of the global oil market.
- Impact of Geopolitical Events: Both WTI and Brent prices can be highly sensitive to geopolitical events and factors, making it essential for traders to stay updated with international news.
Factors Contributing to Volatility and main risks in the Oil markets trading.
Volatility in the oil markets can be attributed to various factors, including:
Geopolitical events: International events, sanctions, or political uncertainty in major oil-producing regions, can disrupt production, transportation, and distribution of oil. This can lead to sudden and significant price fluctuations in the market.
Supply and Demand Dynamics: Any disruptions in the supply chain, geopolitical factors, or changes in demand can lead to abrupt price movements. Sudden changes in supply and demand dynamics, often due to unforeseen events like natural disasters, geopolitical uncertainties, or OPEC decisions, can lead to volatile price movements. A sudden increase or decrease in supply or demand can have a profound impact on oil prices.
Economic factors: Global economic conditions, including factors like recessions, inflation, and changes in GDP growth rates, can significantly influence oil prices. Economic downturns tend to lead to decreased demand for oil, while economic growth can drive up demand.
Currency Movements: Fluctuations in currency exchange rates can affect the purchasing power of oil-importing countries. A stronger local currency relative to the US dollar, which is the primary currency for oil trading, can lead to increased purchasing power and potentially higher demand for oil.
Regulatory Changes and Government Policies: Details: Changes in government policies, including environmental regulations, taxation, and energy transition initiatives, can introduce uncertainty into the oil markets. New regulations may impact production costs, consumption patterns, and market dynamics.
Energy Transition and Environmental Concerns: The global shift towards renewable energy sources and increasing environmental awareness pose a long-term risk to the oil markets. Changes in consumer preferences and government policies towards greener alternatives can lead to reduced reliance on fossil fuels.
Speculative Trading: Traders’ perceptions and expectations can lead to speculative trading, causing sharp price swings.
When volatility typically increases for the WTI and Brent Oil markets:
West Texas Intermediate (WTI):
- Seasonal Trends:
- Winter Months (December – February): Volatility in WTI tends to increase during the winter months. This is primarily due to higher demand for heating oil in colder regions, which drives up overall oil consumption.
- During the trading Week:
- Mondays and Fridays: Mondays and Fridays can sometimes experience increased volatility as traders react to news and events that have occurred over the weekend.
- Wednesdays and Thursdays: Those days usually show the Energy Information Administration Crude Oil Inventories report, which measures the weekly change in the number of barrels of commercial crude oil, held by US firms. When those reports are published, they usually come with the Oil Rig count and are an important barometer for the Oil Drilling industry.
Brent Crude:
- Seasonal Trends:
- Summer Months (June – August): Brent Oil tends to experience higher volatility during the summer months. This is partly due to increased demand for gasoline as people travel more during vacation season.
- Day of the Week:
- Midweek (Tuesday – Thursday): Tuesdays through Thursdays often see higher trading volumes and potential for increased volatility as market participants react to news and economic data releases.
Trading WTI and Brent Oil with CFDs: Strategies and Indicators
Trend Following Strategies:
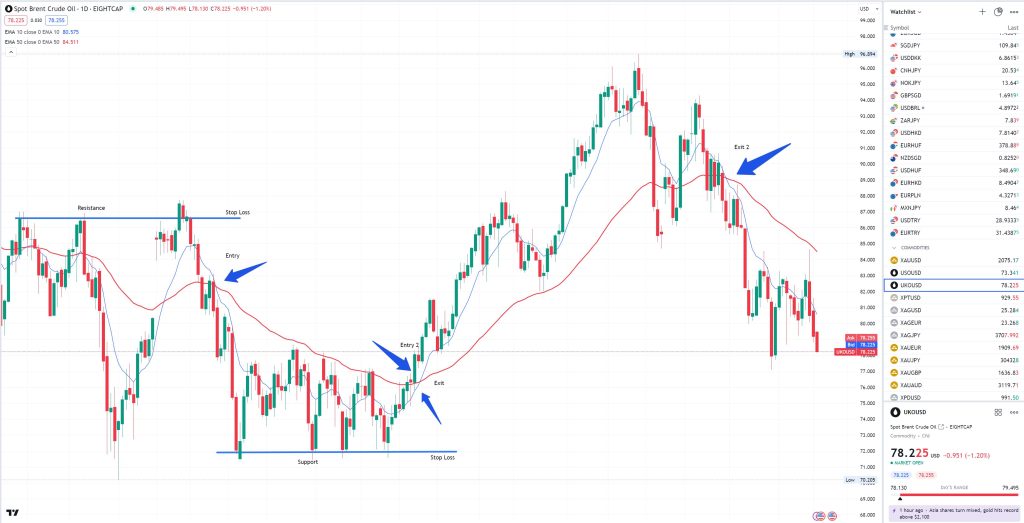
Moving Averages: Utilize simple and exponential moving averages to identify the direction of the prevailing trend. The crossover of short-term and long-term moving averages can signal potential entry or exit points.
Risk Management: When using moving averages, set stop-loss orders at key support or resistance levels. Avoid chasing the trend blindly and be prepared to exit if the trend reverses.
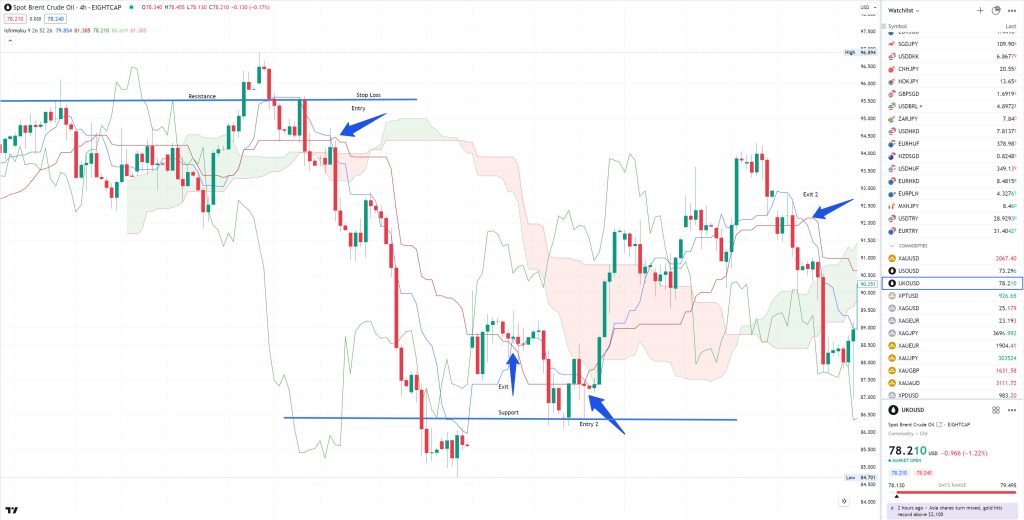
Ichimoku Cloud: The Ichimoku Cloud versatile indicator provides a comprehensive view of support, resistance, trend direction, and momentum. It consists of five lines, including the cloud, which represents potential reversal or continuation zones.
Risk Management: Place stop-loss orders just beyond the cloud or at key support/resistance levels. Pay attention to signals from the Tenkan-sen and Kijun-sen lines for potential trend shifts.
Breakout Strategies:
Bollinger Bands: These volatility bands can help identify periods of consolidation and potential breakouts. Traders look for price action outside the bands as a signal of a potential trend continuation or reversal.
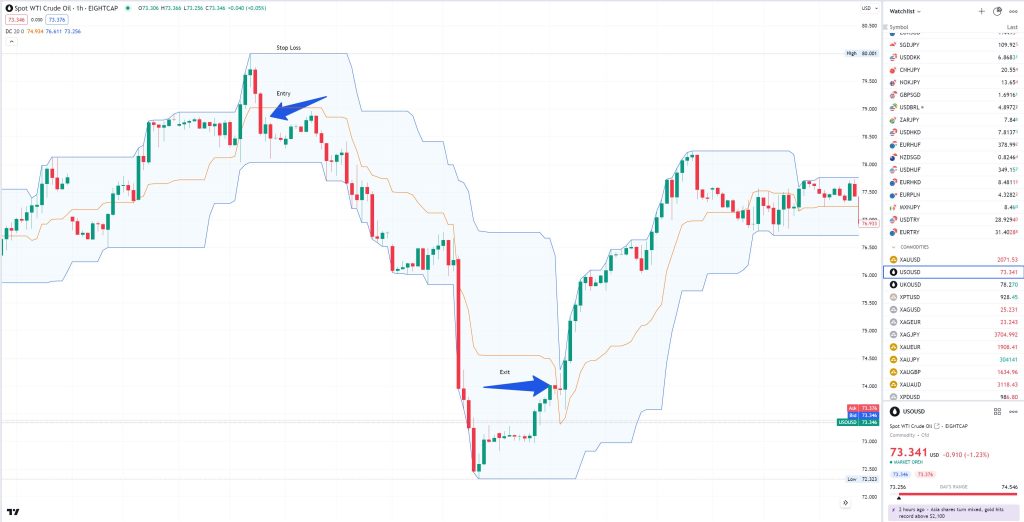
Donchian Channels: These channels help identify breakouts by highlighting the highest high and lowest low over a specified period. Traders watch for price to move outside these channels for potential trading opportunities.
Risk Management: Place stop-loss orders just outside the channel boundaries. Adjust the stop-loss level as the price moves in the direction of the breakout.
Momentum Strategies:
Relative Strength Index (RSI): RSI measures the speed and change of price movements. Oversold or overbought conditions can indicate potential reversals. Combining RSI with trend analysis can lead to powerful momentum strategies.
Risk Management: Avoid relying solely on overbought or oversold conditions. Combine RSI with other indicators or confirmations for more reliable signals. Place stop-loss orders based on support/resistance levels.
Moving Average Convergence Divergence (MACD): This indicator combines moving averages to identify potential buy or sell signals. Traders look for crossovers and divergences to gauge changes in momentum.
Risk Management: Use stop-loss orders in case of false signals. Consider using additional indicators or price action confirmation to validate MACD signals.
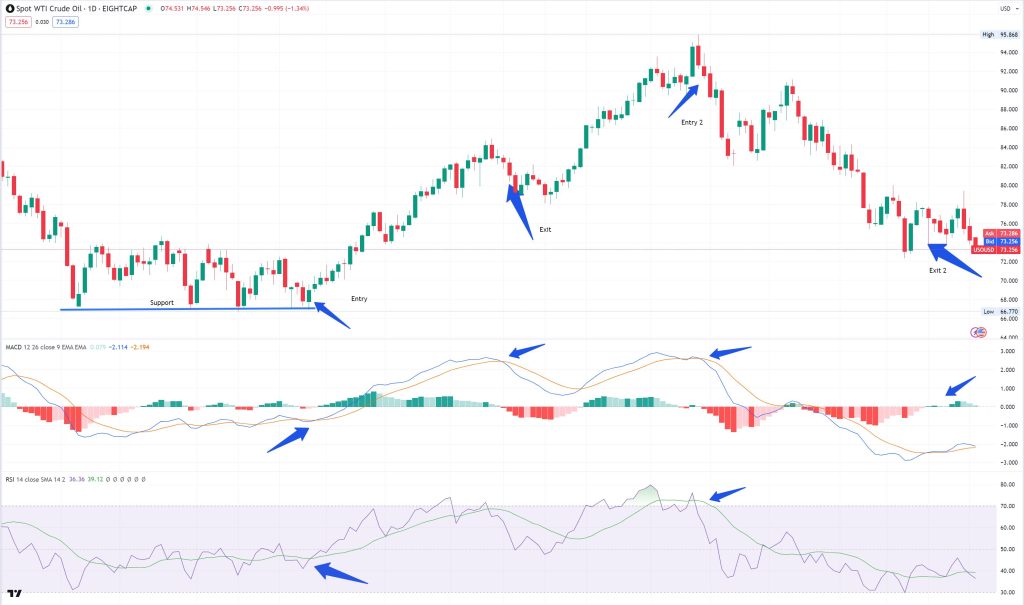
Support and Resistance Strategies:
- Pivot Points: These levels act as potential support and resistance areas. Traders use pivot points to identify key price levels for potential reversals or breakout points.
- Risk Management: Place stop-loss orders slightly beyond pivot levels. Adjust the stop-loss as the price approaches the next pivot point.
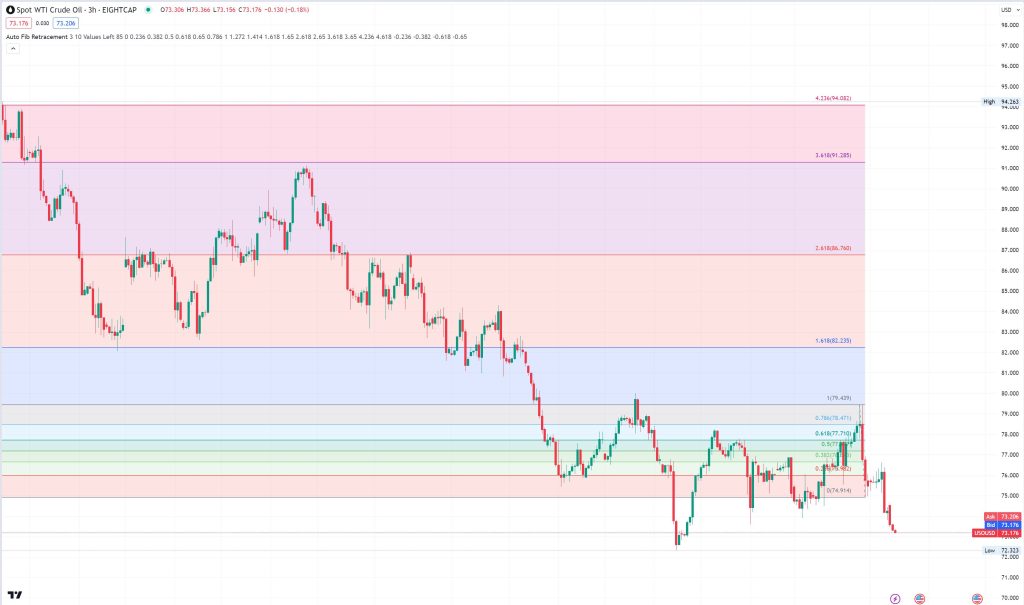
- Fibonacci Retracement: Based on the Fibonacci sequence, this tool helps identify potential support and resistance levels based on historical price movements.
- Risk Management: Set stop-loss orders just beyond key Fibonacci levels. Combine with other indicators or chart patterns to confirm potential reversals or breakout points.
News and Events Analysis:
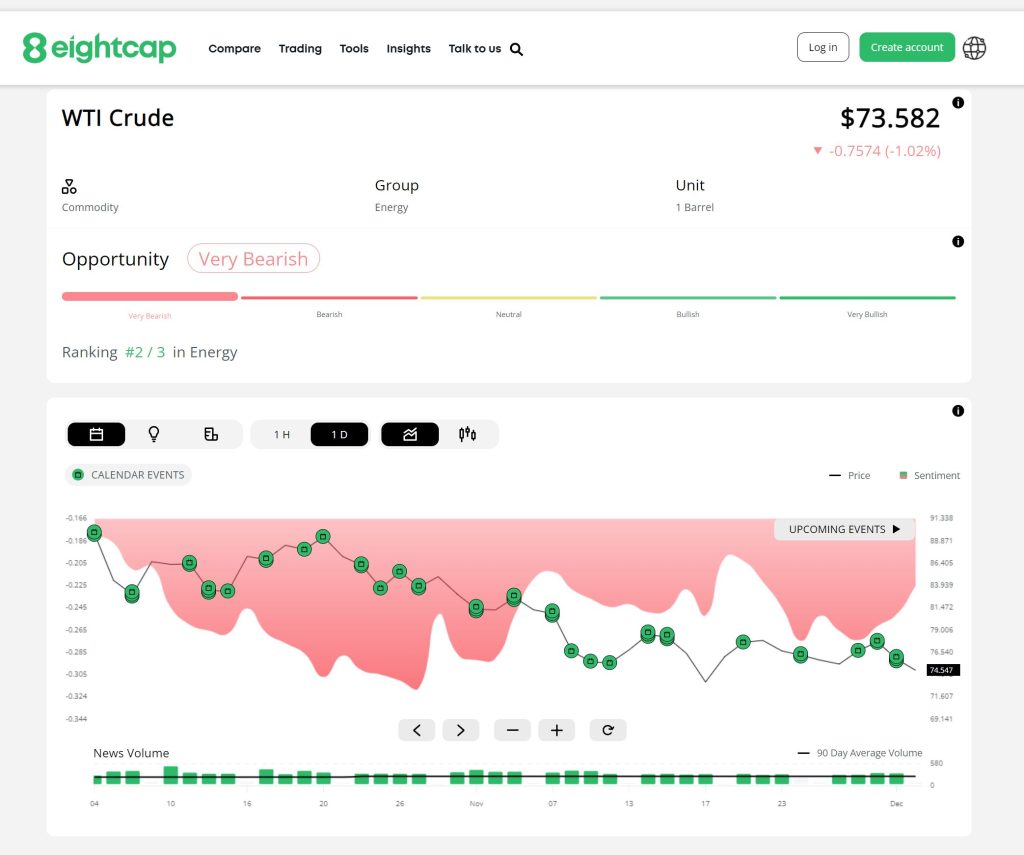
- Economic Calendar: Staying updated with economic events and news releases is crucial for oil traders. Major announcements like OPEC decisions, inventory reports, and geopolitical factors can have significant impacts on oil prices. Feel free to experience our state-of-the-art Economic Calendar displaying all details related to events, reports and announcements as well as Sentiment analysis.
- Risk Management: Avoid trading during major economic announcements due to heightened volatility and uncertainty. If a trade is open, consider tightening stop-loss levels.
Volatility Indicators (e.g., ATR):
- Average True Range (ATR) can help traders gauge the level of market volatility. When news events are imminent, observing ATR can provide insights into how much the price might move, aiding in setting appropriate stop-loss levels and position sizes.
- Risk Management: Adjust position sizes based on ATR readings to account for potential increased volatility. Tighten stop-loss levels to protect against exaggerated price swings during news releases.
News Sentiment Analysis:
- Utilize sentiment indicators or platforms that aggregate news sentiment to gauge market sentiment. Positive or negative sentiment can influence trader behavior and subsequently impact oil prices.
- Risk Management: While sentiment analysis can provide valuable insights, always cross-verify with technical and fundamental analysis to make well-informed trading decisions. Be cautious of over-reliance on sentiment indicators alone.
Price Action Patterns:
- Price action patterns, such as engulfing patterns, doji candles, and inside bars, can signal potential reversals or continuation of trends following significant news events.
- Risk Management: Combine price action patterns with other indicators or technical analysis to confirm signals. Set stop-loss orders at key support or resistance levels identified through price action analysis.
Correlation with Currency Pairs:
- Given the interconnection between oil prices and currency values, monitoring the correlation between major currency pairs (e.g., USD/EUR) and oil prices can provide valuable insights into potential price movements.
- Risk Management: Be aware of currency-related risks, as changes in exchange rates can impact oil prices. Adjust position sizes or consider hedging strategies to mitigate currency-related fluctuations.
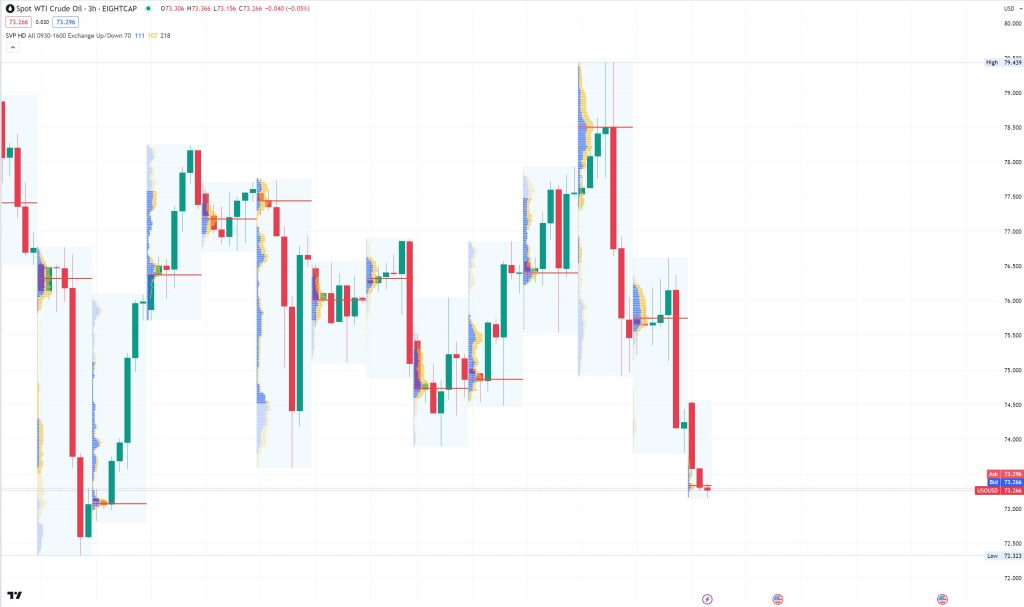
Custom Indicators on TradingView:
- Volume Profile: This indicator displays the volume traded at each price level, providing insights into areas of high trading activity. Traders can use this to identify potential support and resistance zones.
- Risk Management: Use stop-loss orders based on support/resistance levels identified by the volume profile. Be cautious of low-volume areas, as they may indicate potential price reversals.
- Vortex Indicator: Designed to identify the start of a new trend, the Vortex Indicator considers positive and negative trend movements. A crossover can signal a potential change in trend direction.
- Risk Management: Set stop-loss orders based on key support/resistance levels. Consider using additional indicators or price action confirmation to validate vortex signals.
- McClellan Oscillator: This indicator helps traders identify overbought or oversold conditions in the market. It uses advancing and declining issues to gauge market breadth.
- Risk Management: Place stop-loss orders based on support/resistance levels. Avoid relying solely on oscillator signals; use them in conjunction with other indicators.
Combining Strategies:
- Successful oil trading often involves a combination of these strategies. For example, traders might use a trend-following strategy alongside support and resistance levels identified by indicators like Fibonacci retracement.
- Risk Management: When combining strategies, be cautious of overcomplicating your approach. Set stop-loss orders based on the combined analysis and consider the overall risk exposure of your trades.
General Risk Management Tips:
Regardless of the chosen strategy, implementing effective risk management is paramount. Set stop-loss orders, diversify your trades, and only use leverage that you can afford to lose.
- Position Sizing: Avoid risking more than a set percentage of your trading capital on a single trade. This helps distribute risk and protects against significant losses.
- Diversification: Do not put all your capital into a single trade or strategy. Diversify your trades across different prices, different assets or markets to spread risk.
- Continuous Monitoring: Regularly review and adjust stop-loss levels as the trade progresses. Stay vigilant for any changes in market conditions or unexpected events.
- Oil markets report releases: Always be informed when a report on the Oil markets is released and be prepared to make changes in the overall exposure. Those reports have the power to cause price swings and create short-term trends.
By incorporating these strategies and leveraging the powerful indicators available on TradingView, oil traders can enhance their decision-making process and navigate the volatile oil markets with greater confidence. Remember, it’s crucial to practice responsible trading and be prepared for potential market fluctuations.
Navigating the dynamic world of oil trading, particularly with WTI and Brent Oil CFDs, demands a nuanced approach and comes with both opportunities and challenges. Understanding the unique characteristics of each benchmark, recognizing the factors driving volatility, and employing effective trading strategies with sound risk management are essential steps towards success. As oil markets continue to evolve, staying informed and adaptable will be key to making informed decisions. Whether you’re a seasoned trader or just beginning to explore these markets, remember that responsible trading practices and a disciplined approach are the cornerstones of more effective trading. Always remember that responsible trading, continuous learning, and the ability to adjust to changing conditions are key to potential success in the ever-changing world of oil markets. Embrace the challenges, seize the opportunities, and may your endeavors in oil trading be rewarding and fruitful.
* The information provided here has been prepared by Eightcap’s team of analysts. All expressions of opinion are subject to change without notice. Any opinions made may be personal to the author and do not reflect the opinions of Eightcap.
In addition to the disclaimer on our website, the material on this page does not contain a record of our trading prices, or represent an offer or solicitation for a transaction in any financial instrument. Eightcap accepts no responsibility for any use that may be made of these comments and for any consequences that result. No representation or warranty is given as to the accuracy or completeness of this information. Consequently, any person acting on it does so entirely at their own risk. Any research provided does not have regard to the specific investment objectives, financial situation and needs of any specific person who may receive it. It has not been prepared in accordance with legal requirements designed to promote the independence of investment research and as such is considered to be a marketing communication.
Please note that past performance is not a guarantee or prediction of future performance. This xpcommunication must not be reproduced or further distributed without prior permission.